Daily Market Analysis
Market Focus
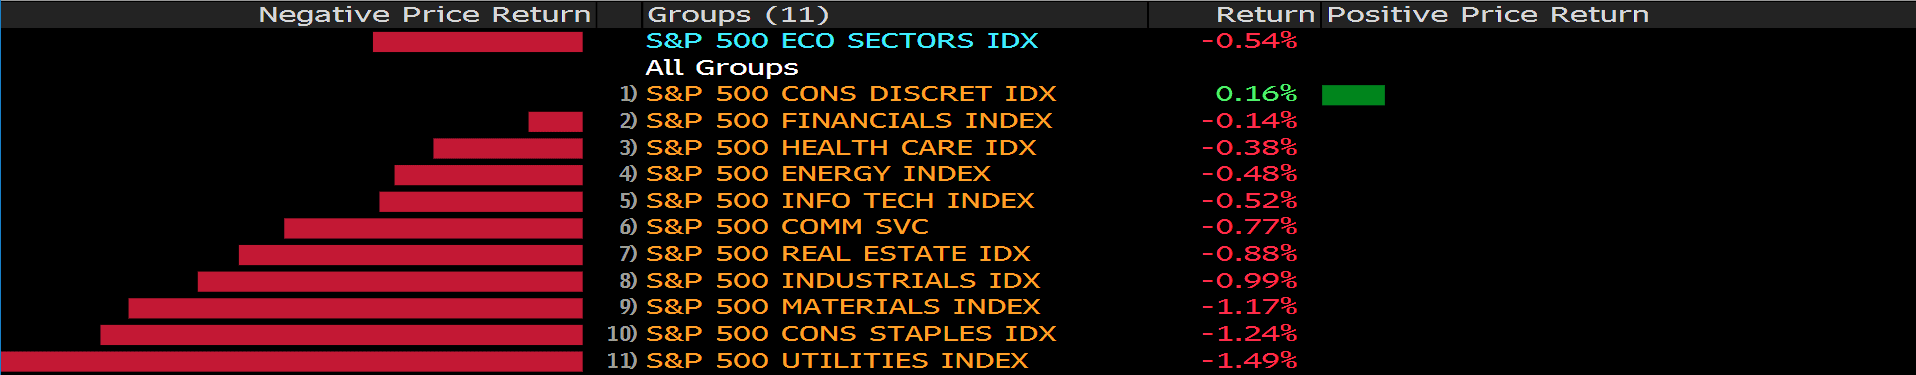
US equity market dropped as Federal Reserve is actually more hawkish than market expected. Though the initiation of tapering talk is widely anticipated, but two interest rate hikes by the end of 2023 reveal by the dot plot had investors surprised. The Nasdaq 100 and Dow Jones Industrial Average index lost 0.34% and 0.77% respectively. All sectors closed in the red within the S&P 500 index except for Consumer Discretionary shares. The 10-year US Treasury yield surged 7.5 basis points to 1.57%.
The Federal Reserve kept interest rate unchanged, and here are Bloomberg’s key takeaways from the FOMC statement and Chair Jerome Powell’s press conference:
– Inflation: Inflation forecasts for this year moved up, with PCE rising to 3.4% from 2.4% and core PCE to 3% from 2.2%. Next year’s forecasts for both edged up just a tenth of a percentage point to 2.1%, signalling Fed participants don’t see this year’s jumps lasting significantly into next year.
– Dot plot: The 2023 median dot was higher, a lot higher. It showed 13 officials seeing at least one rate hike in 2023 and 11 seeing two. Additionally, 7 participants are calling for a rate high as early as 2022. Only five members had rates unchanged, and the median is now 0.625%. Powell tried to calm the market by saying the main takeaway from the dot plot should be that many participants are more comfortable that the economic conditions in the Fed’s forward guidance will be met somewhat sooner than previously thought.
– Unemployment rate: forecast at 4.5 in 2021, 3.8 in 2022, and 3.5 in 2023 from 4.5, 3.9 and 3.5 respectively. Powell said labor supply and demand are not matching up well, but that it should clear in coming months.
– IOER: there was a five basis point hike to 0.15%.
– Tapering: Fed will begin meeting-by-meeting to assess progress towards goal and talk about tapering, and emphasize tapering will be “orderly, methodical and transparent”.
Main Pairs Movement:
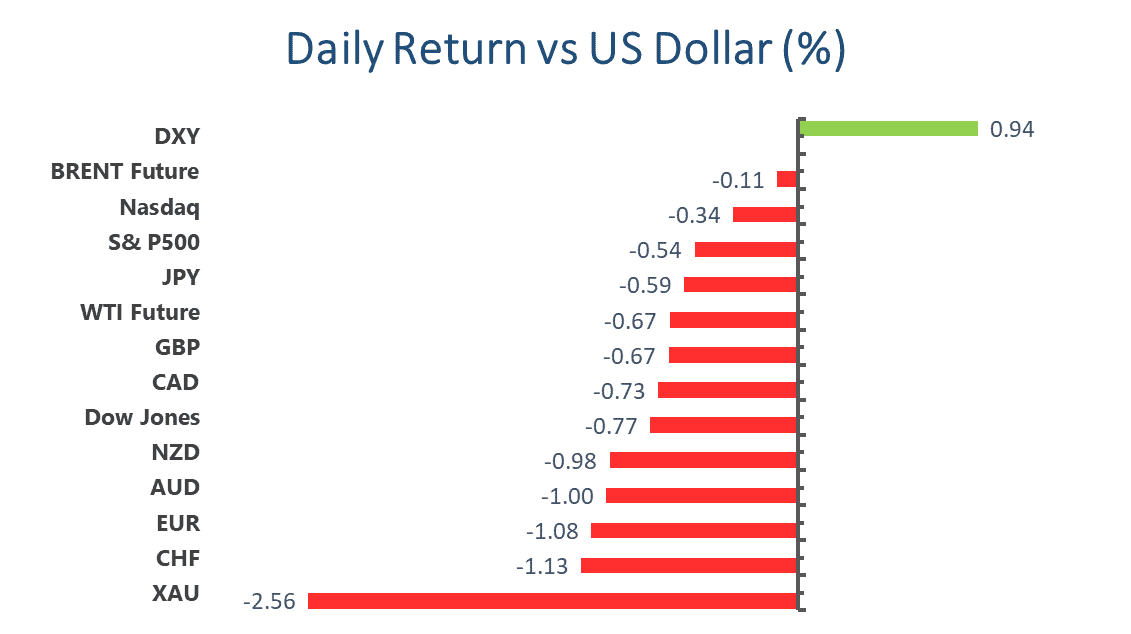
Euro is the second worst performing currency against the dollar on Wednesday, the first being Swiss Franc, plunged 0.97% and 1.11% respectively. The Fed has turned from extreme dovish to slightly hawkish, and will finally start to kick off the long-expected tapering talks in forthcoming meetings. Given ECB’s plan to bulk up monetary and fiscal spending in the second half of 2021, this officially marks the divergence between Federal Reserve and European Central Bank. The outlook for Euro is not so bright in the 2H20.
Cable also fell 0.6% amid strengthening dollar. Today’s plunge is more likely a temporary shock to the Sterling rather than a long-term bearish trend like the Euro. Speculators are still factoring in the delayed of reopening from the Britain. However, we don’t think this delay will prolong into the summer given UK’s successful vaccination campaign. Once the delta variant concern is taken off the table, the UK economy will steer in full speed. An optimistic and hawkish BoE will continue to underpin the Pound, ad it is highly possible that they will act ahead of the Federal Reserve in easing QE.
Technical Analysis:
GBPUSD (Daily Chart)
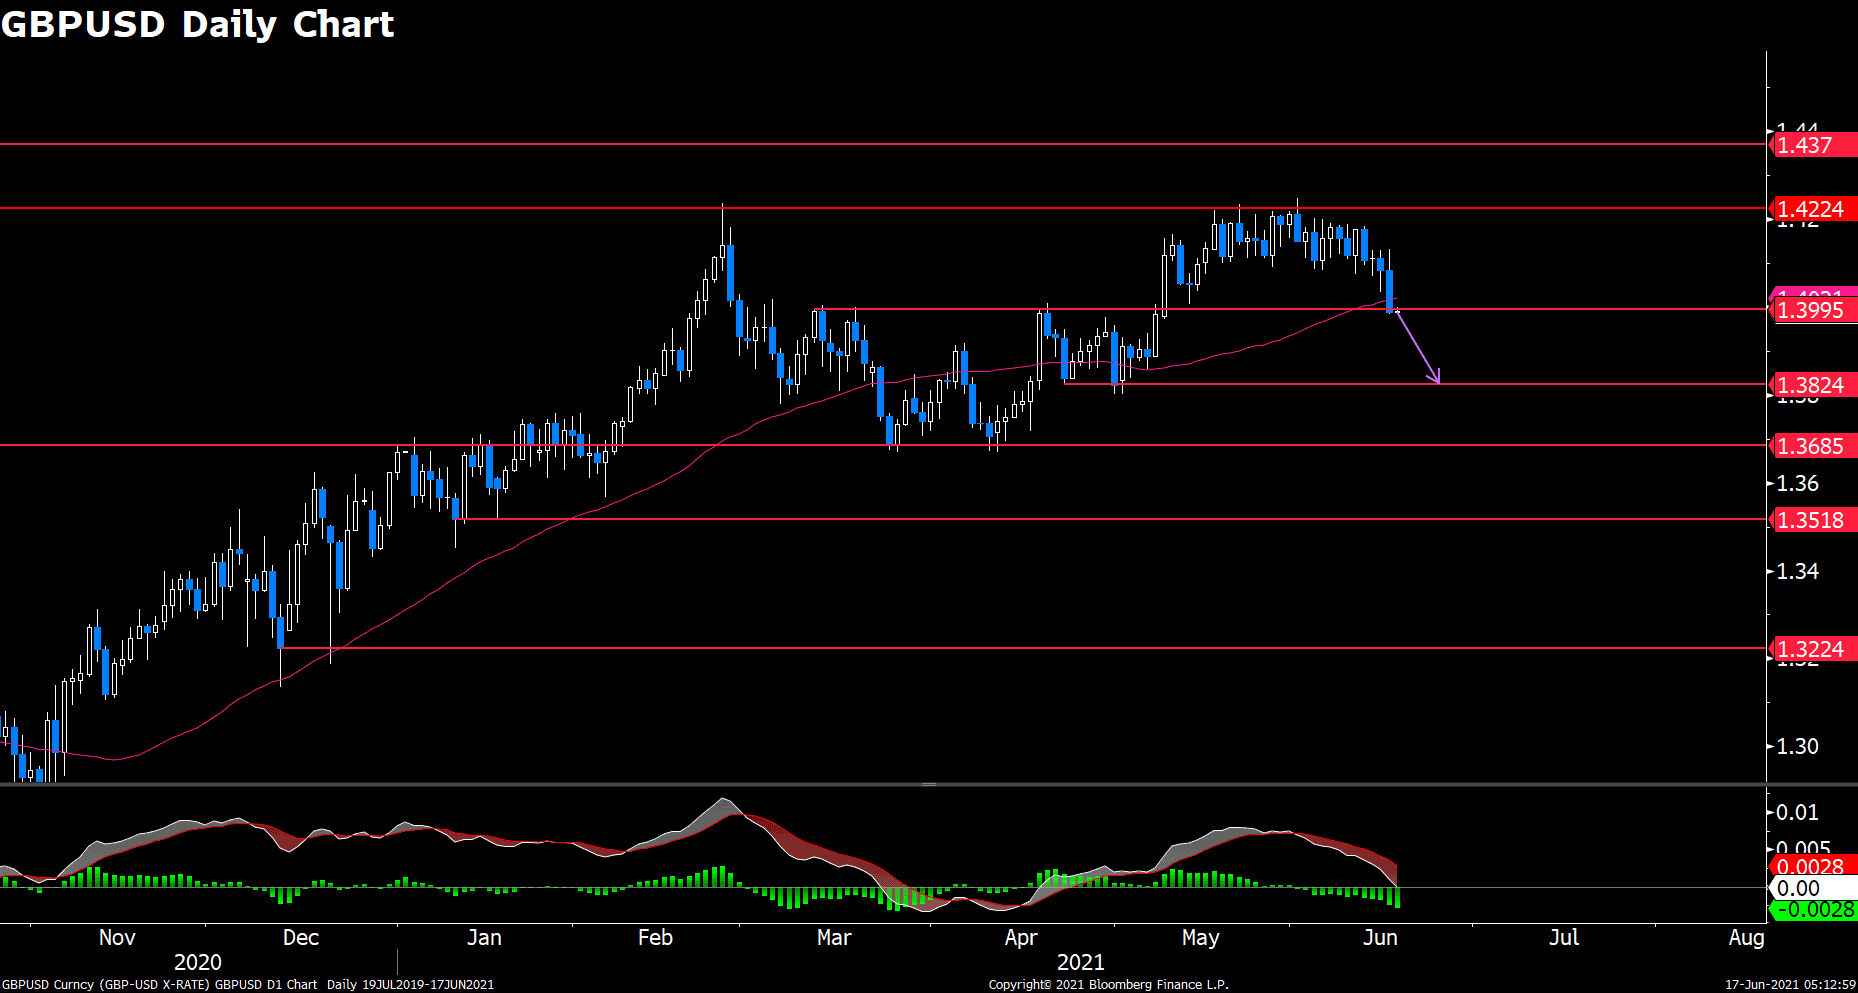
Cable finally exited its consolidation phase from downside. After trapped within a tight range between 1.42 and 1.408 for more than a month, the bears are set to seek gains in the south. Price promptly plunged toward the ascending trendline after FOMC statement release, and was finding support around 1.402 as of writing. Further on the downside, an immediate horizontal resistance would be the big 1.4 round number, followed by May’s low of 1.38, and 1.367.
Resistance: 1.42, 1.437, 1.464
Support: 1.4, 1.382, 1.369
XAUUSD (Daily Chart)
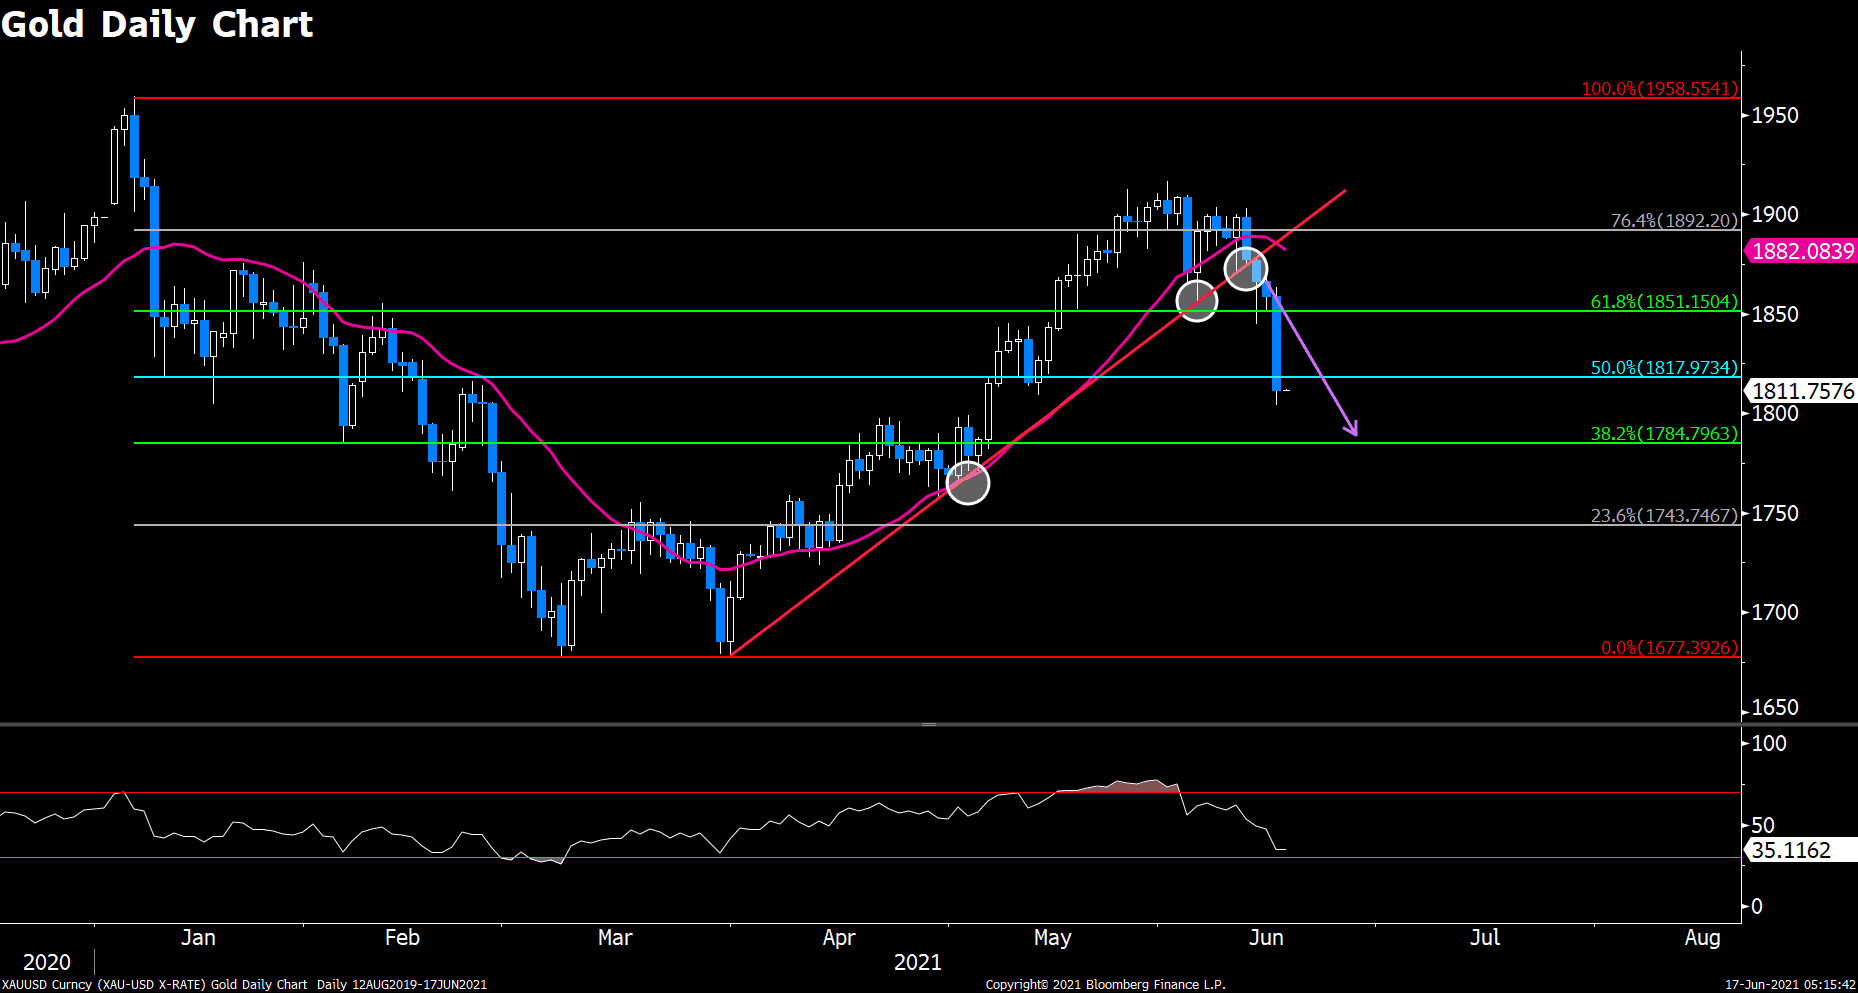
XAUUSD continues to head south after penetrated the 2-month ascending trendline and DMA20 dynamic support. The yellow metal breached below 61.8% Fibonacci level of $1850, which previously defended bears’ attack. Closing below this level could open doors for sellers to capitalize on large downside space, where we might witness February’s huge plummet in gold price given the lack of inflation-hedge demand post FOMC meeting. On the downside, $1815 will be the next key level to watch for.
Resistance: 1890, 1920, 1960
Support: 1815, 1780, 1743
USDCAD (Daily Chart)
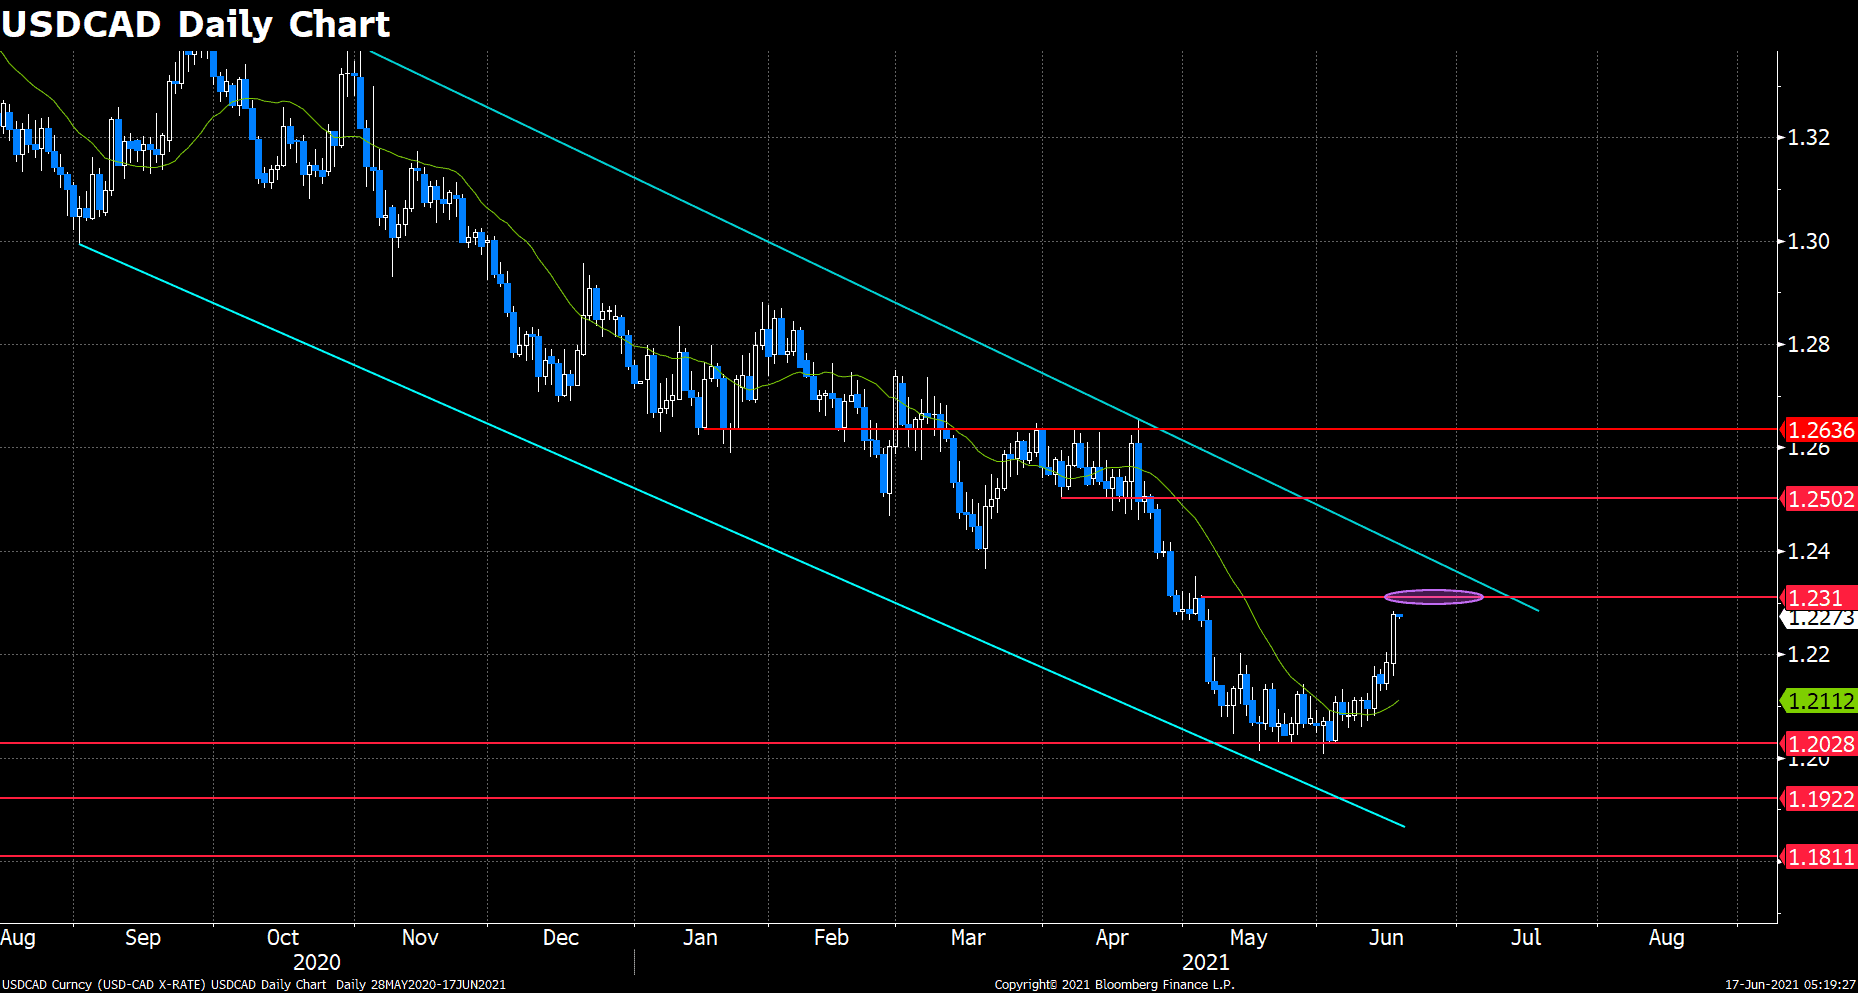
USDCAD is undergoing a U-shape recovery after price was extremely subdued for the past two-months. However, it is not completely out of the woods yet since a big downward trendline still hangs above current price level, we need to see a solid breakout from the trendline to confirm a bullish reversal in USDCAD. In the near term, this pair looks to contest 1.23 hurdle, and failing to overcome this level could put the bears back into the driver’s seat as the persistent higher oil price always bolsters the Canadian dollar.
Resistance: 1.23, 1.25, 1.264
Support: 1.2, 1.1925, 1.18
Economic Data
|
Currency |
Data |
Time (GMT + 8) |
Forecast |
||||
|
NZD |
GDP (QoQ) (Q1) |
06:45 |
0.5% |
||||
|
AUD |
Employment Change (May) |
09:30 |
30.0K |
||||
|
CHF |
SNB Interest Rate Decision |
15:30 |
2.0% |
||||
|
CHF |
SNB Press Conference |
16:30 |
|||||
|
EUR |
CPI (YoY) (May) |
17:00 |
|||||
|
USD |
Initial Jobless Claims |
20:30 |
359K |
||||
|
USD |
Philadelphia Fed Manufacturing Index (Jun) |
20:30 |
31.0 |
||||
|
USD |
Fed Chair Yellen Testifies |
22:00 |
|||||

This site uses cookies to provide you with a great user experience.
By using vtmarkets.com, you accept our
cookie policy.

اختر نوع الحساب وأرسل طلبك


موّل حسابك باستخدام مجموعة واسعة من طرق الإيداع

الوصول الى أكثر من 1000 أداة عبر جميع فئات الأصول.


![]()
Follow us on:


![]()


