


Key Points
- S&P 500 futures down 3.11% by 4:42 a.m. ET, with the index now over 20% off its peak—formally entering a bear market.
- 10-year US Treasury yields drop to 3.953% as recession risks climb and traders price in a fifth Fed rate cut this year.
The US stock market is facing one of its most volatile weeks in years as escalating trade tensions and macroeconomic pressures drive traders out of equities and into safer assets.
At 4:42 a.m. ET (0942 GMT), S&P 500 E-mini futures fell 159 points, or 3.11%, following a brutal two-session slide that erased 10.5% from the index and wiped out nearly $5 trillion in market capitalisation. The benchmark S&P 500 has now dropped more than 20% from its all-time highs, effectively meeting the technical definition of a bear market—the first since the pandemic-induced crash of March 2020.
President Donald Trump’s refusal to ease tariffs or negotiate with China until the US trade deficit is corrected has spurred panic across global markets. Traders are interpreting this as a signal that the trade war could drag on longer than previously expected, deepening economic pain.
The Nasdaq 100 futures dropped 598.5 points (-3.41%), while Dow futures were down 1,178 points (-3.06%). The Nasdaq Composite itself has now also entered bear market territory, led by a steep sell-off in technology stocks. The Dow Jones Industrial Average has slumped over 10% from its recent record close.
Flight to Safety Intensifies
Bond markets are flashing warning signals as traders rush into safe-haven assets. The 10-year US Treasury yield has plunged to 3.953%, marking a swift retreat below the psychological 4% level. This reflects strong demand for government bonds as market participants brace for an economic downturn.
Traders have now priced in a 54% probability of a fifth interest-rate cut from the Federal Reserve this year, suggesting that monetary easing may be necessary to stabilise the economy amid a deepening trade crisis.
The CBOE Volatility Index (VIX)—commonly referred to as Wall Street’s fear gauge—spiked 7.57 points to 52.88, its highest reading since the early days of the COVID-19 panic. This level of implied volatility implies continued disorder in the short-term outlook for risk assets.
Technical Analysis
The 15-minute candlestick chart for the S&P 500 (SP500) shows a steep downward trajectory, with the price dropping from a high of 4964.07 to a low of 4802.15, before attempting a modest rebound to close at 4886.02. Short-term moving averages (5, 10, 30) remain in bearish alignment, indicating sustained selling pressure.
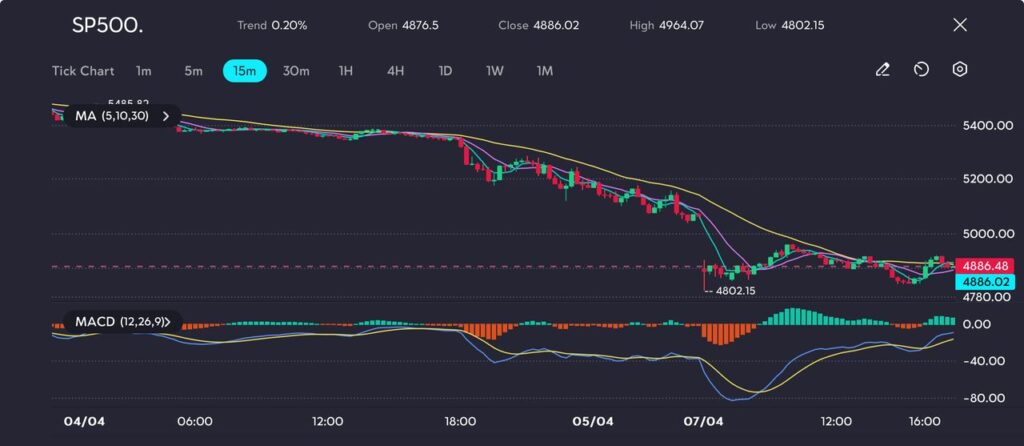
Picture: From sell-off to setup—SP500 claws back after touching fresh lows, as seen on the VT Markets app
The MACD (12,26,9) shows bearish momentum easing slightly, with the histogram beginning to shift green after deep troughs, suggesting early signs of technical relief—but no clear reversal yet.
The market may be due for a brief technical bounce, but downside risks remain elevated. Traders should watch the 4,800 support level, a break below which could lead to a swift retest of February lows.
Cautious Forecast
Given the sharp rise in volatility and the hawkish stance on trade from Washington, market conditions are likely to stay unstable. The prospect of further interest-rate cuts may offer a medium-term cushion, but sentiment remains fragile. Any short-term rallies could prove to be bear market traps unless fundamental data—like Thursday’s consumer price figures—deliver a material shift in the inflation narrative.
Traders should stay defensive. Expect continued rotation into bonds and safe-haven sectors, while equity markets may trend lower until clearer policy signals emerge.


