


Key Points
- S&P 500 closes at 6018.10, down 0.38%, after earlier testing 6057.4
- Global equities retreat as Israel-Iran conflict reignites and oil climbs 7.5% since Friday
The S&P 500 drifted lower on Tuesday, closing at 6018.10 and trimming gains from a recent test of 6057.4. The index slipped 0.38% on the day as investor sentiment cooled amid mounting geopolitical tension and heightened central bank watch. The broader risk-off move mirrored declines across European and Asian bourses, with futures pointing sharply lower in the early European session.
Markets were rattled overnight as renewed strikes between Israel and Iran dashed hopes of a short-lived flare-up. The situation took a darker turn when U.S. President Donald Trump urged Iranians to evacuate Tehran and reportedly convened the national security council. His abrupt departure from the G7 summit added to market unease, sparking concerns of broader U.S. involvement. While a White House aide denied that Washington had launched any military action, Defence Secretary Pete Hegseth confirmed the U.S. would defend its regional assets if provoked.
The renewed conflict lifted oil markets sharply. Brent and WTI futures rose another 2% during Asian hours, building on the 7.5% surge seen since Friday. Energy-related equities benefitted from the commodity spike, but broader equity sentiment turned cautious. Gold also held firm near recent highs, reflecting safe-haven demand.
Despite the cross-border jitters, FX markets remained relatively stable. The U.S. dollar regained safe-haven favour, even as traders continued to price in a high probability of a Fed rate cut later this year. The euro and yen saw muted movement following central bank commentary, while yields held steady as traders waited for additional guidance.
Market participants now turn their focus to this week’s central bank meetings. The Bank of Japan held rates steady as expected, but flagged a slower pace of bond tapering. Markets interpreted the decision as a signal of continued caution rather than the start of decisive normalisation. Reaction was tepid, with the yen and JGB yields barely budging.
Technical Analysis
The S&P 500 (15-minute chart) shows a cautious grind higher that stalled at the 6057.4 resistance mark, followed by a mild retracement toward the 6000–6012 support band. Momentum appears to be fading as the MACD histogram turns flat and the signal line converges with the MACD line, indicating the recent rally may be losing steam.
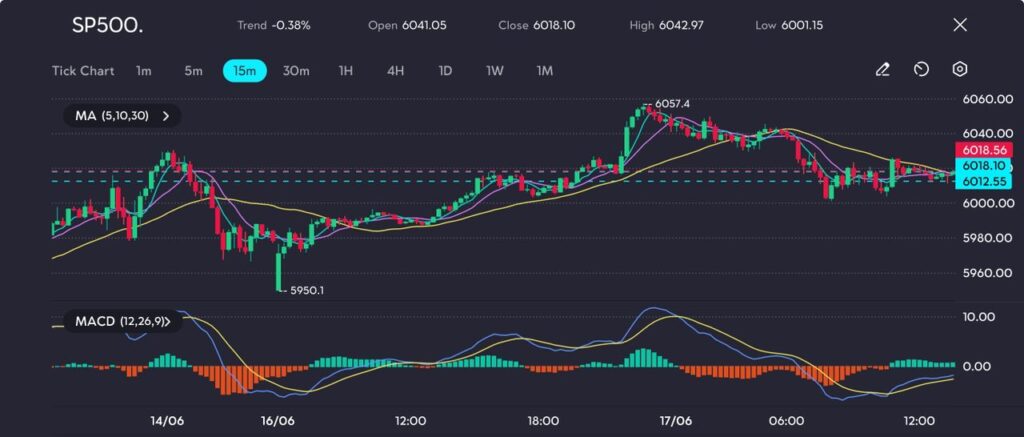
Picture: S&P 500 clings to 6000 amid fading momentum, as seen on the VT Markets app
The index managed to recover from the 5950.1 low on 14 June, climbing steadily as tech stocks led broader gains. However, despite the strong bounce, price action now sits near a consolidation zone, hovering just above the 30-period moving average. Price is also struggling to make a clean break above the 6050–6060 resistance ceiling, which has acted as a cap for much of the past two sessions.
With global risks unresolved and central bank decisions looming, equities could see further swings as traders adjust positioning. Volatility may increase into the week’s close.


