Key Points
- Nasdaq 100 rebounds from 21439.75 intraday low, closes at 21663.50
- Asia-Pacific stocks mixed as oil eyes third straight weekly gain
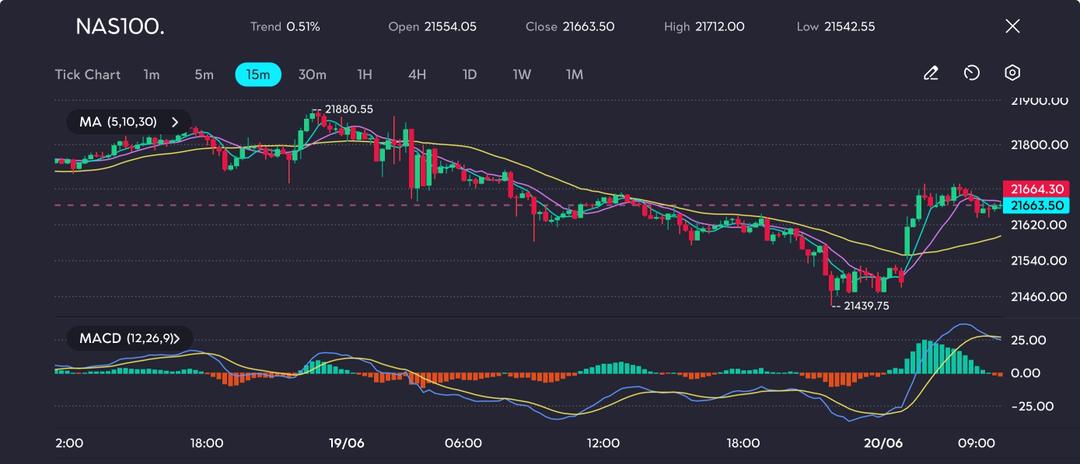
The Nasdaq 100 index recovered moderately in early Friday trading, bouncing from a session low of 21439.75 to close near 21663.50. Despite opening flat and initially extending its overnight decline, the tech-heavy index found footing as the MACD histogram turned positive, while price action climbed above its 15-minute moving averages.
The rebound came amid a hesitant broader tone in Asian markets. Traders remained cautious as Israel continued its airstrikes on Iranian nuclear targets, while Iran retaliated with missile and drone strikes of its own. With the conflict now in its second week and no clear exit strategy in sight, market participants remained on edge.
President Donald Trump has reportedly given himself a two-week window to decide on potential US military intervention—reviving a pattern seen in previous major foreign policy standoffs. The White House’s ambiguity weighed on market risk appetite overnight, particularly for futures markets. Nasdaq and S&P 500 futures both shed 0.3% in Asian hours, amplifying uncertainty after US markets remained closed for the Juneteenth holiday.
Technical Analysis
The NASDAQ 100 is staging a technical rebound after hitting a local bottom at 21439.75. After peaking near 21880.55 on 19 June, the index entered a clear downward channel, forming lower highs and lower lows, indicating short-term bearish sentiment. The correction extended into the early session of 20 June before the bounce began.
Picture: Bulls regain footing after sharp Nasdaq dip, as seen on the VT Markets app
Today’s bounce has broken through the short-term moving averages (5 and 10 EMA) with a sharp uptick in price momentum. The MACD shows a bullish crossover from oversold territory, with the histogram strongly green before slightly flattening—suggesting the initial thrust may be cooling.
Currently, NAS100 is testing the 21660–21680 zone. This was a key consolidation area during the recent downtrend and could act as short-term resistance. A clean breakout above 21712.00 (intraday high) could open the way for a retest of 21800+. Failure to clear this level may lead to a mild pullback toward 21580 or even 21540, where support from the rising 30 EMA is developing.
A break above 21712.00 could re-energise bulls, while a return to sub-21500 levels would likely usher in renewed selling, especially if headlines out of the Middle East worsen.


