





Key Points
- The Hang Seng Index dipped below 24,000 during Tuesday’s session before recovering near 24,207 on the daily chart.
- Renewed tensions around the Strait of Hormuz lifted oil prices and reduced risk appetite across Asian markets.
- Technology and AI-related shares were among the main drags, with Tencent, Meituan, Xiaomi, Knowledge Atlas and MiniMax trading lower.
- China’s June trade data beat forecasts, with exports rising 27.0% year on year and imports increasing 36.0%.
- The HSI daily chart places immediate resistance near 24,250, while 24,000 and 23,900 are the key support levels to monitor.
The Hang Seng Index fell during Tuesday morning trading on 14 July 2026 as renewed geopolitical uncertainty and weaker global equity cues reduced risk appetite across Asian markets.
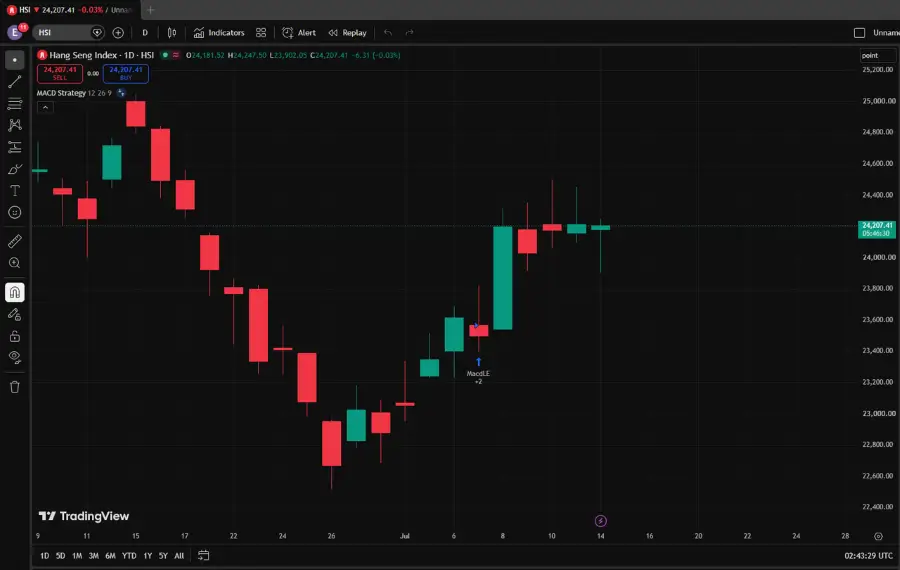
The Hong Kong benchmark slipped about 1.0%, or 240 points, to around 23,970 earlier in the session, briefly moving below the psychological 24,000 level. However, the attached daily chart later showed HSI recovering near 24,207, leaving the index close to flat on the session.
The early move reflected broad caution rather than a single Hong Kong-specific development. US stocks had declined overnight, while renewed tensions around shipping through the Strait of Hormuz lifted oil prices and increased concerns about inflation and interest rates.
Why Traders Are Watching This
Traders are watching the Hang Seng Index because the market is being influenced by several competing forces.
Higher oil prices can create additional inflation pressure for economies that depend heavily on imported energy. This may reduce expectations for looser monetary policy and weigh on equity valuations, particularly in technology and other growth-sensitive sectors.
Brent crude rose during early Asian trading after renewed US-Iran tensions raised concerns about energy shipments through the Strait of Hormuz. At the same time, the previous US session ended lower, with the S&P 500 declining around 0.8% and the Nasdaq Composite falling around 1.6%.
The combination of rising energy prices, firmer bond yields and weaker US technology shares created a more cautious environment for Hong Kong stocks.
Technology Shares Lead the Weakness
Technology shares were among the main drags on the Hang Seng Index during the early session.
Tencent and Meituan each fell around 1.5%, while Xiaomi declined approximately 0.5%. AI-related names also came under pressure, with Knowledge Atlas falling around 4.9% and MiniMax losing approximately 3.1%.
Weakness in these heavily followed companies matters because technology and AI-related shares play an important role in Hong Kong market sentiment. Continued selling in major growth names may make it harder for the broader index to recover, even if other sectors remain stable.
Strong China Trade Data Provides a Counterweight
The initial Hang Seng decline occurred while traders were waiting for China’s June trade figures.
Data released later showed that China’s US dollar-denominated exports increased 27.0% from a year earlier, exceeding the 18.2% growth forecast in a Reuters poll. Imports rose 36.0%, also beating expectations, while the trade surplus expanded to around $125.6 billion.
The stronger figures provide a more constructive signal for external demand and manufacturing activity. However, the data do not remove the geopolitical, energy-price and interest-rate risks affecting global equity markets.
For the HSI, the immediate question is whether stronger Chinese economic data can stabilise sentiment or whether global risk aversion continues to dominate short-term price action.
Key Trading Levels
| Level | What Traders Are Watching |
| 25,000 | Psychological recovery level if bullish momentum strengthens |
| 24,800 | Wider resistance and earlier breakdown area |
| 24,500 | Key resistance zone watched by futures traders |
| 24,250 | Immediate resistance near the latest session high |
| 24,207 | Current chart area |
| 24,000 | Psychological pivot and near-term support |
| 23,900 | Latest session low area and immediate downside support |
| 23,600 | Initial pullback support and recent recovery zone |
| 23,200 | Lower short-term support within the rebound structure |
| 22,800 | Recent recovery base and broader downside reference |
The HSI daily chart shows the index trading near 24,207 after opening around 24,181.52. The latest session high stood near 24,247.50, while the low was approximately 23,902.05.
The index briefly moved below 24,000, but the recovery back above that level suggests that buyers are still defending the lower end of the recent rebound zone.
Immediate resistance is located near 24,250, which aligns with the latest session high. A sustained break above this area could bring 24,500 into focus.
A stronger recovery would require a break above 24,500, which could shift attention towards 24,800 and then the psychological 25,000 level.
On the downside, 24,000 is the first support level to monitor. A break below 23,900 would suggest that the rebound is weakening, while a deeper move below 23,600 could expose 23,200 and 22,800.
Bullish and Bearish Setups
| Setup | Trigger | Potential Market Reaction |
| Bullish Recovery | Move above 24,250 | HSI may retest 24,500 |
| Bullish Extension | Break above 24,500 | Buyers may target 24,800 |
| Stronger Breakout | Daily close above 25,000 | Broader recovery structure may improve |
| Pullback Hold | Price holds above 24,000 | Short-term rebound may remain intact |
| Bearish Break | Fall below 23,900 | HSI may retest 23,600 |
| Deeper Pullback | Break below 23,600 | Downside may extend towards 23,200 and 22,800 |
The bullish recovery depends on HSI moving above 24,250 and holding that level. This would suggest that buyers are regaining short-term control after the intraday dip below 24,000.
A confirmed break above 24,500 would strengthen the recovery setup and bring 24,800 into focus. If buyers clear that area, the psychological 25,000 level becomes the next major resistance.
The neutral scenario is consolidation between 23,900 and 24,250. This would suggest that traders are waiting for clearer signals from oil prices, China data, US inflation expectations and broader Asian risk sentiment.
The bearish scenario strengthens if HSI falls below 23,900. A confirmed break could bring 23,600 into focus, followed by 23,200 and the broader support area near 22,800.
Disclaimer
The price levels and trade scenarios above reflect the author’s view at the time of writing and do not represent financial advice or an official recommendation from VT Markets. Traders should conduct their own analysis and manage risk carefully.
Trade Hang Seng Index CFDs With VT Markets
The Hang Seng Index remains active when PBoC policy signals, China economic data, AI stocks, exporters and broader Asian risk sentiment move together.
With VT Markets, traders can access HK50 and HK50ft CFDs alongside forex, gold, oil, indices, shares, ETFs and other global CFD markets from one platform. This helps traders follow Hong Kong’s equity market while also tracking related moves in the US dollar, oil prices, US technology shares and global risk appetite.
Use VT Markets’ charting tools to monitor support, resistance, moving averages and breakout behaviour as the next Hang Seng Index setup develops.
Start trading indices with VT Markets today.
What Traders Should Watch Next
Several upcoming developments may influence the next Hang Seng move.
Markets have become more sensitive to the possibility that higher energy prices may keep inflation elevated and delay expectations for easier monetary policy.
Traders will also assess whether China’s strong June trade performance is reflected in upcoming economic releases. China’s second-quarter growth figures and activity data may provide a broader view of domestic demand, manufacturing and property-sector conditions.
Oil prices and developments around the Strait of Hormuz will remain important external drivers. A reduction in geopolitical tension could support risk sentiment, while further disruption may increase volatility across Hong Kong stocks and other Asian markets.
For now, 24,000 to 24,250 is the main short-term range. A confirmed break above 24,250 could bring 24,500 into focus, while a move below 23,900 may expose 23,600.
Frequently Asked Questions
Why did the Hang Seng Index fall?
The HSI fell as renewed geopolitical tensions, higher oil prices, weaker US equity cues and broad caution across Asian markets reduced demand for risk-sensitive assets. Losses in technology and AI-related shares added to the pressure.
Why is the 24,000 level important?
The 24,000 level is a widely watched psychological area. A move below it may indicate weaker short-term momentum, while a recovery above it can suggest that some selling pressure is being absorbed.
Did China’s trade data support the Hang Seng Index?
China’s June exports and imports beat market forecasts, providing a positive signal for trade and manufacturing activity. However, traders are also watching global factors such as oil prices, US interest-rate expectations and geopolitical developments.
Which Hong Kong stocks were among the main laggards?
Tencent, Meituan, Xiaomi, Knowledge Atlas and MiniMax were among the companies trading lower during the early session. Weakness in technology and AI-related shares contributed to broader caution.
What could influence the next HSI move?
The next move may be shaped by US inflation data, Federal Reserve signals, China’s upcoming economic releases, oil-price movements and developments around the Strait of Hormuz. Traders may also monitor whether the HSI can hold above 24,000 and break above 24,250.
Start trading now — click here to create your real VT Markets account.








