Key points:
- Spot gold falls to $2,330.44 per ounce.
- Strengthening US dollar and higher Treasury yields pressure gold prices.
- Traders focus on upcoming U.S. core PCE inflation data.
This article is a follow up from: Gold rises ahead of key US data inflation data
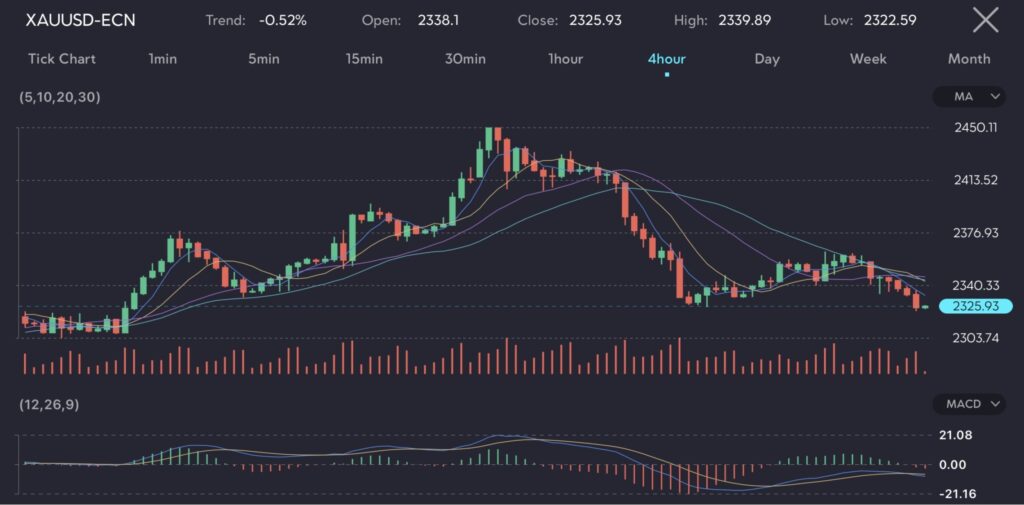
Gold (Symbol: XAUUSD) declined for the second consecutive session on Thursday, pressured by a stronger US dollar (USD) and rising Treasury yields ahead of key US inflation data. Spot gold retraced to the $2,330.44 per ounce price level.

Picture: Retracement of gold prices as observed on the VT Markets app.
Gold has declined by more than $100 since reaching a record high of $2,449.89 on May 20. Hawkish comments from Federal Reserve officials and recent meeting minutes have pointed to a prolonged path to the 2% inflation target. While gold is traditionally seen as an inflation hedge, higher interest rates increase the opportunity cost of holding the non-yielding asset.
In other precious metals, silver (Symbol: XAGUSD) fell to $31.40, platinum (Symbol: XPTUSD) was down at $1,032.25, and palladium (Symbol: XPDUSD) dropped to $944.75. These declines reflect broader market concerns about rising interest rates and their impact on non-yielding assets.
What is weighing gold prices down
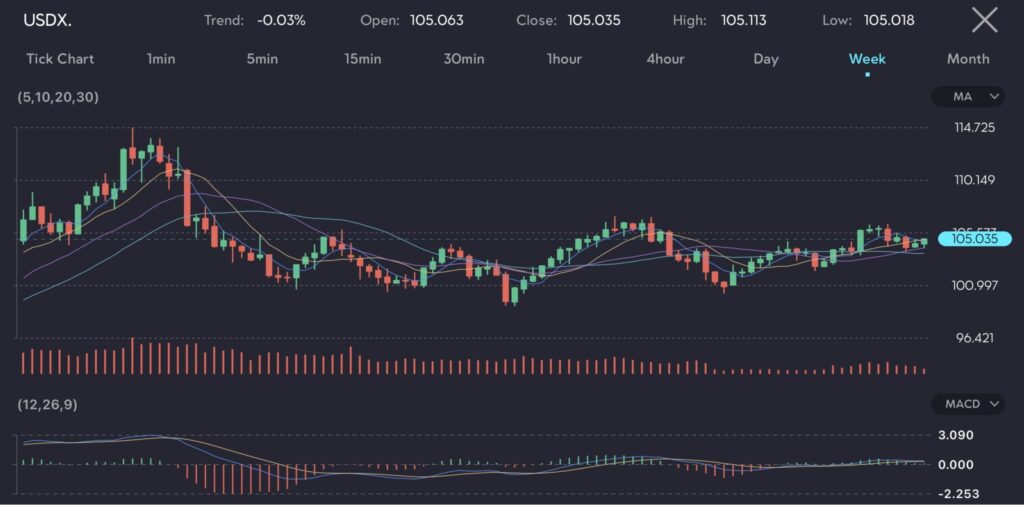
The US dollar index (Symbol: USDX) strengthened, making dollar-priced gold less attractive to investors holding other currencies. Concurrently, benchmark US 10-year bond yields remained near multi-week highs, pulling gold prices further down.
Picture: How the US Dollar Index is strengthening on the VT Markets app.
On the flip side, traders are currently pricing in the possibility of rate cuts.
What should traders be looking out for this week
The upcoming US core personal consumption expenditures (PCE) data, the Fed’s preferred inflation measure, is due on Friday. This data will be closely watched for indications of future monetary policy direction.
Gold prices may remain under pressure if the US core PCE data indicates persistent inflation, reinforcing expectations of continued high interest rates. A strong dollar and elevated Treasury yields will likely limit the upside potential of gold. However, should inflationary pressures ease, there could be room for a recovery in gold prices as the market adjusts its expectations for Fed rate cuts.


