


Daily market analysis
June 13, 2022
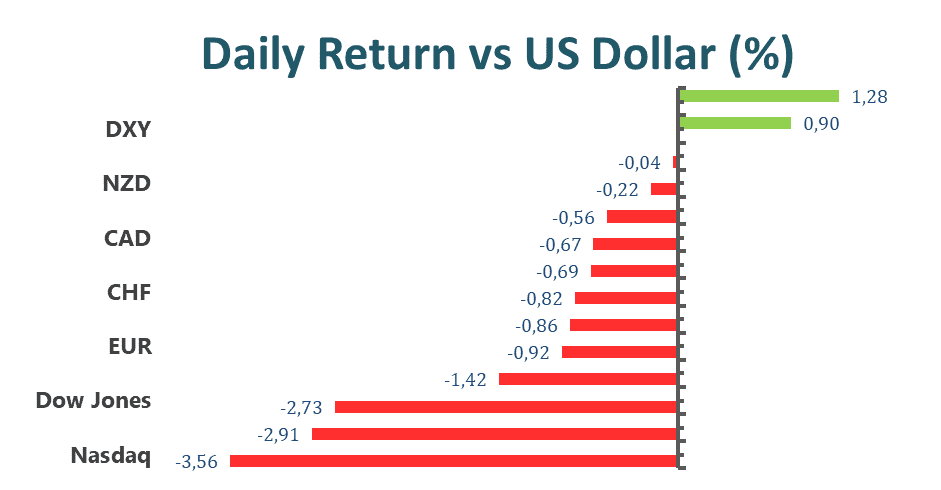
US equity markets lost ground on Friday following the inflation indicator, CPI, which rose 8.6% in May, the highest level since 1981. The Dow Jones Industrial Averages slid 2.73% while the S&P 500 shed 2.91%, to 3900.85. The Nasdaq Composite dropped 3.56%, to 11832.82. The inflation accelerated further in May. The CPI rose 8.6% from a year ago, and the core CPI was up 6%, also higher than the expected, 5.9%. Markets reacted negatively and confronted selling pressures to the reports as investors worried about acting more aggressively from the Fed; some economists even predicted the Fed might hike rates by as much as 3 basis points, 0.75% next week.

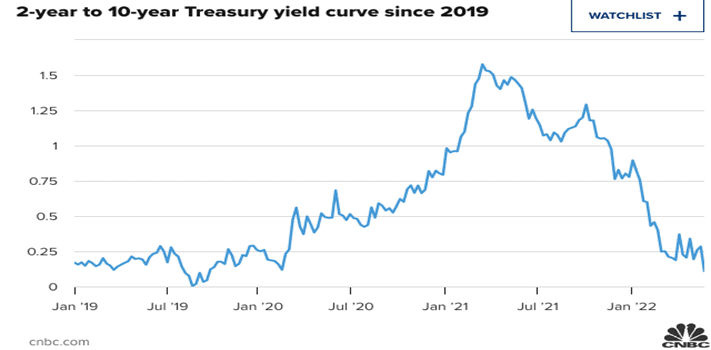
In the bond market, markets were closely monitoring and fearful of a recession; investors were watching the bond market. the short-term bond, 2-year Treasury yield reached 3.06%, and the long-term bond, 10-year Treasury yield, reached 3.159. The spread between the two bonds was only 10 basis points. If the 2- year Treasury bond yield moved above the 10- year, then the inverted yield happened again, a recession signal.
Main Pairs Movement
Gold, recovered from the multi-week low and reached 1871.61 on a volatile Friday. Fundamentally, gold is still confronted with sizeable losses as investors continued to seek refuge in the safe-haven greenback amid the soaring inflation and a more aggressive monetary policy from the Fed. Further price actions eye on the FOMC meeting.
EUR/USD lost ground on Friday, sliding 0.92% to 1.05170. The safe-haven greenback dominated the markets after the US CPI report and consumer confidence data from the US, signalling a solid move to the greenback as the Fed might be more aggressive on its policy.
USD/JPY continued to head north, finishing with 134.317, breaking its 20- year peak. The BOJ’s dovish isolation, keeping its YCC measures and ultra-loose policy, continued to give pressure on the Japanese Yen.
AUD/USD dropped to a fresh two-week low, back below the 0.7100 level in reaction to higher than expected US CPI. The Aussie faced aggressive selling as investors sought a refuge, thus the demand for the safe-haven greenback increased.
Technical Analysis
EURUSD (4-Hour Chart)
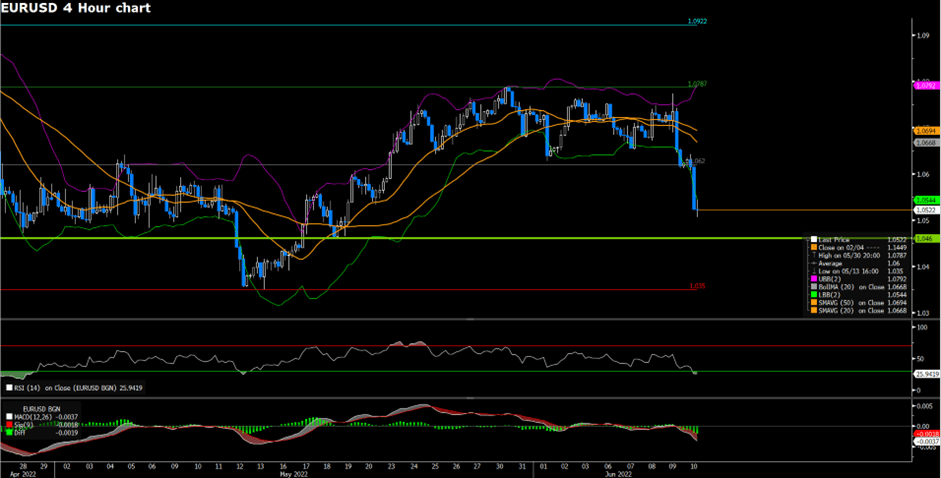
EURUSD continued to head lower on the last trading day of the week. The rallying Dollar exerted intense selling pressure on the Euro. The highly anticipated U.S. CPI report came in red hot at 8.6%, year over year. The benchmark U.S. 10-year Treasury yield shot above 3.1% as market participants priced in a possibility of a further interest rate hike by the Fed. The ECB’s Thursday meeting did not add confidence to the Euro as the central bank is only committed to a 25 basis point interest rate increase and lowered economic guidance for the rest of the year.
On the technical side, EURUSD has dropped below our previously estimated support level of 1.06477 and is heading towards 3-year lows. Support levels for EURUSD now sit at near the 1.05031 price region, which is a 2017 low. RSI for the pair sits at 39.93, entering oversold territory. On the four-hour chart, EURUSD is trading below its 50, 100, and 200-day SMA.
Resistance: 1.07691
Support: 1.06477
GBPUSD (4-Hour Chart)
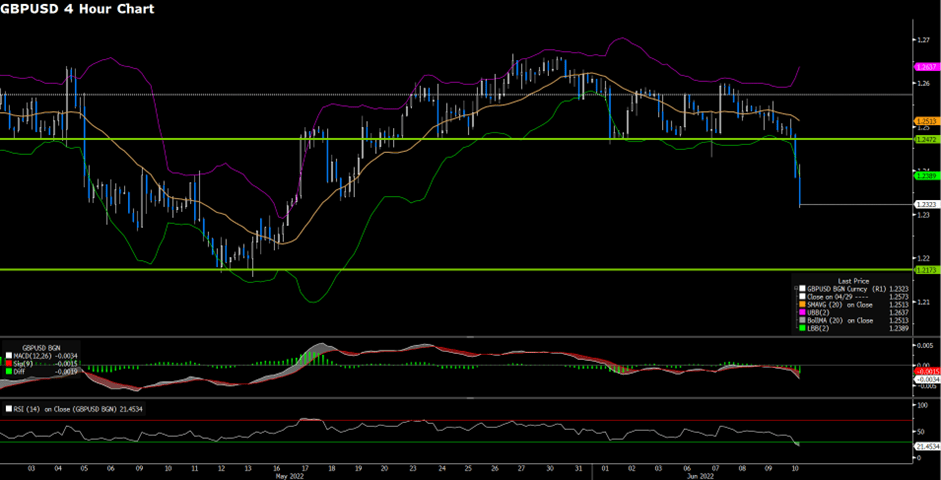
GBPUSD fell sharply on the last trading day of the week as the dollar rallied. The red hot U.S. CPI report propelled the U.S. 10-year Treasury yield above the 3.1% level. On Thursday, British Prime Minister Boris Johnson announced a proposed tax cut for households in an attempt to boost the British economy; however, the British Pound failed to gain traction. Next week’s FOMC meeting will be closely watched by market participants.
On the technical side, GBPUSD has dropped below our estimated support level at 1.24539 and is pounding towards the following near-term support level at 1.21996. RSI for Cable sits at 38.26, as of writing. On the four-hour chart, GBPUSD currently trades well below its 50, 100, and 200-day SMA.
Resistance: 1.25944
Support: 1.21695
USDJPY (4-Hour Chart)
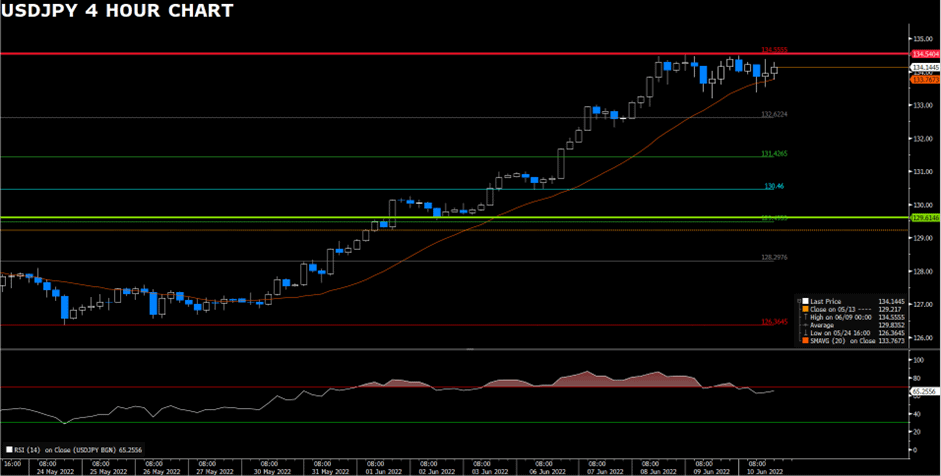
USDJPY rose on the last day of the trading week as the Dollar index rallied past the 104 level. The U.S. CPI data came in at 8.6%, year over year. With inflation continuing to run high, market participants are pricing in possibly more aggressive interest rate hikes by the Fed. Next week’s FOMC should guide the interest rate trajectory for the rest of the year.
On the technical side, USDJPY has risen near our estimated resistance level at 134.56. RSI for the pair has risen to 67.05 and once again entered the overbought territory. On the four-hour chart, USDJPY is trading above its 50, 100, and 200-day SMA.
Resistance: 134.56
Support: 133.5, 132.5
Economic Data
| Currency | Data | Time (GMT + 8) | Forecast |
| AUD | Australia- Queen’s Birthday | All Day | – |
| RUB | Russia Day | All Day | – |
| GBP | GDP (YoY) | 14:00 | – |
| GBP | GDP (QoQ) | 14:00 | – |
| GBP | GDP(MoM) | 14:00 | – |
| GBP | Manufacturing Production (Apr) | 14:00 | 0.2% |
-
Global - English

-
United Kingdom - English
-
France - Français

-
Spain - Español

-
Portugal - Português

-
Italy - Italiano

-
Germany - Deutsch

-
Turkey - Türkçe

-
MENA - العربية

-
MENA - English
-
Asia - English
-
India - English

-
Indonesia - Indonesia

-
Japan - 日本語

-
South Korea - 한국어

-
Malaysia - Bahasa Malaysia

-
Malaysia - English
-
Philippines - English

-
Vietnam - Tiếng Việt

-
Thailand - ไทย

-
China - 简体中文

-
China - 繁體中文

This site uses cookies to provide you with a great user experience.
By using vtmarkets.com, you accept
our cookie policy.
Start trading with
VT Markets today


![]()
Follow us on:


![]()


