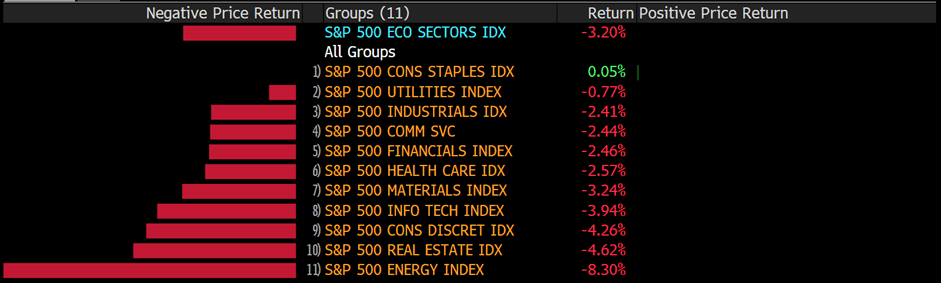
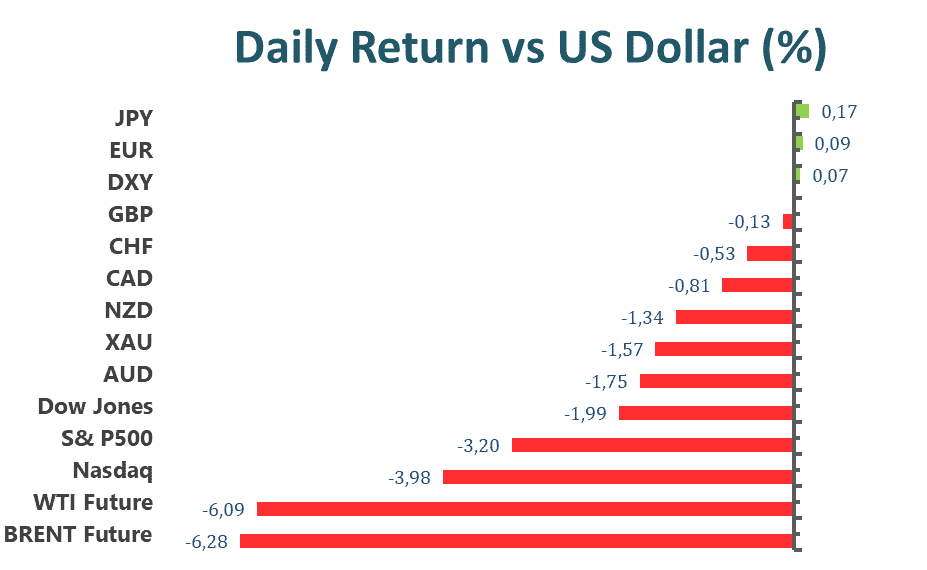
U.S. equities fell sharply on the first trading day of the week. The Dow Jones Industrial Average dropped 1.99% to close at 32245.7, the S&P 500 slid 3.2% to close at 3991.24, and the Nasdaq Composite tumbled 4.29% to close at 11623.25. The benchmark U.S. 10-year Treasury yield, on the other hand, climbed well past the 3% mark during trading. The technology sector continues to bear the brunt of this wave of equity revaluation. FAANG+ has plunged, despite beating earnings estimates. Risks of stagflation have initiated a frenzy sell-off by market participants.
Palantir Technologies, once a heavily weighted stock in Cathie Wood’s Ark Technologies ETF, reported 2 cents per share earnings and 446 million in revenue. Although the company was able to deliver better than expected earnings, the board of the company issued weak guidance than sent the share price of Palantir in a downward spiral, falling more than 21%.
The cryptocurrency market is also experiencing a major revaluation as treasury yields continue to climb. Bitcoin has dropped back to the $30,000 territory and Etherium is now trading at $2250. The drop in cryptocurrency valuation also affected cryptocurrency-linked equities, such as Nu Holdings.
This week’s U.S. CPI data is getting more crucial for market participants as markets get increasingly volatile. This CPI figure could indicate whether inflation has peaked and it could also indicate whether the Fed’s tightening has delivered on its purpose.
Main Pairs Movement
The Dollar Index continued to climb higher on the first trading day of the week. With treasury yields rising, so did the demand for the U.S. Greenback. Currently, on the FOMC dot plot, the consensus terminal interest rate for 2022 sits at around 2.67%.
EURUSD rebounded 0.11% throughout yesterday’s trading. Despite a stronger U.S. Dollar, market participants flocked to the Euro as it is now sitting near 2017 lows. Bearish signals continue to surround the EURUSD pair.
GBPUSD ended the day trading mostly sideways. The pair closed 0.01% lower than its previous close. During the American trading session, Cable was able to recover most of its intraday losses due to the plummeting U.S. equities market.
USDCAD climbed 0.77% over the previous trading day. The Dollar rallied against the Canadian Loonie as global commodity prices continue to correct from recent highs.
Technical Analysis
EURUSD (4-Hour Chart)
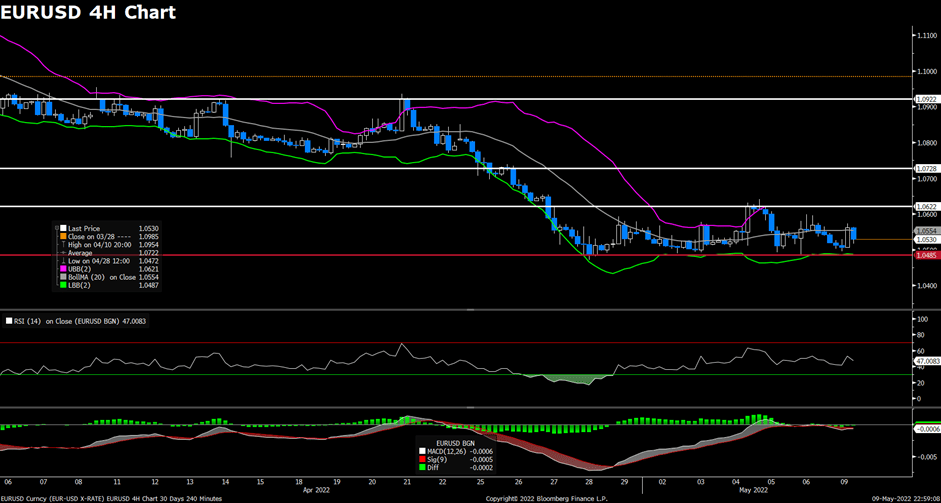
Due to safe-haven demand, the EUR/USD pair moved lower on Monday but was unable to sustain its recovery in the afternoon. The pair mounted a decent recovery throughout the European session after striking daily lows, but subsequently lost its bullish momentum and forfeited its daily gains. The pair is currently trading at 1.0529, representing a daily loss of 0.15 percent. EUR/USD remains in a negative territory amidst renewed US dollar gains, as a further steep decline in global equity markets offers support to the safe-haven US dollar. Concerns regarding central bank tightening and declining global growth weighed on the market mood. As the ECB is not anticipated to tighten monetary policy at a faster rate, the Fed/ECB policy divergence may continue to operate as a headwind for the EUR/USD pair.
As of this writing, the RSI indicator is 46, indicating that the downside is more likely as long as the RSI remains below the zero line. As the price is falling relative to the Bollinger Bands’ moving average, a continuation of the downward trend can be anticipated. In conclusion, we believe the market will be bearish as the pair approaches the 1.0485 support; a breach below this level might pave the way for near-term losses. The declining RSI also shows bearish indications.
Resistance: 1.0622, 1.0728, 1.0922
Support: 1.0485
GBPUSD (4-Hour Chart)
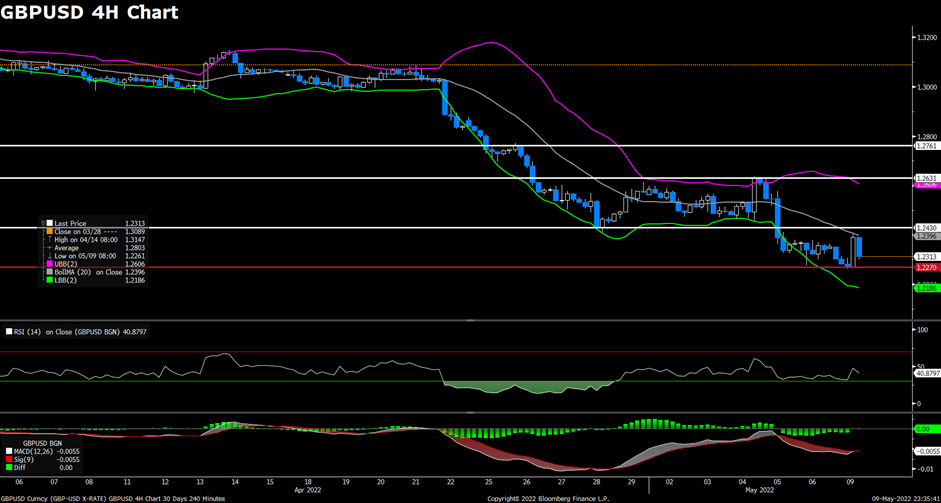
In a risk-averse market environment, the GBP/USD pair dropped on Monday, losing its upward momentum and failing to extend its recovery. Despite reaching a daily high above the 1.240 mark during the European session following a slide to daily lows, the pair began to witness heavy selling and fell towards the 1.230 area ahead of the US session. At the time of writing, the cable maintains a daily loss of 0.16 percent. Negative factors such as central bank tightening, weakening global growth, and worries of a recession helped the US dollar regain upward momentum throughout the US session. The dovish Bank of England and its gloomy economic prognosis might continue to exert bearish pressure on the cable since the outlook indicated that the UK economy was at risk of recession.
As of this writing, the RSI indicator has reached 40 digits, indicating that the pair is seeing selling pressure as the RSI continues to decline. For the Bollinger Bands, the price failed to cross above the moving average and declined towards the lower band, indicating that downside momentum should persist. In conclusion, we believe the market will be negative as the pair approaches the 1.2270 support level. A break over the 1.2430 level might be interpreted as positive and would open the door to the 1.2631 level of resistance.
Resistance: 1.2430, 1.2631, 1.2761
Support: 1.2270
USDCAD (4-Hour Chart)
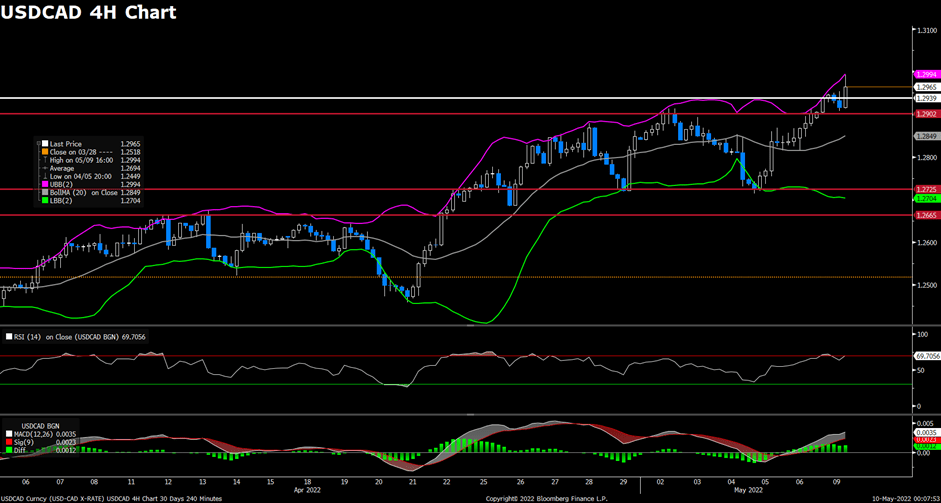
The USD/CAD pair maintained upward momentum and extended its surge that began last week as a result of the pessimistic sentiment surrounding the equity markets. The pair flirted with the 1.2931.295 range for the majority of the day and struck a daily low near 1.291, but fresh buying emerged to wipe out all of its daily losses. At the time of writing, the USD/CAD exchange rate was 1.2964, up 0.43 percent for the day. The anticipation of a more aggressive Fed policy tightening could continue the USD/bullish CAD’s momentum. In addition, declining crude oil prices weakened the commodity-linked Canadian dollar and worked as a tailwind for the USD/CAD pair. China’s authorities continue to struggle with its zero-Covid-19 goal, which is a symptom of weakening oil demand.
Technically speaking, the RSI indicator is 70 at the time of writing, indicating that the pair is facing intense buying pressure and is in the overbought zone, thus a trend reversal could be anticipated. According to the Bollinger Bands, the price continued to move alongside the upper band, hence the upward trend should stay. As the pair is currently challenging the 1.2939 resistance, we believe the market will be bullish. Consistent strength above that level would favor the bulls, and the rising RSI also indicates bullish indications.
Resistance: 1.2939
Support: 1.2902, 1.2725, 1.2665
Economic Data
| Currency | Data | Time (GMT + 8) | Forecast |
| EUR | German ZEW Economic Sentiment (May) | 17:00 | -42.0 |
| BRL | BCB Copom Meeting Minutes | 19:00 |