US equities climbed Tuesday, recouping some of the week’s losses as investors sifted through a barrage of quarterly reports for signs of how corporate America fared against the backdrop of Eastern Europe’s war and mounting inflationary pressures. The S&P 500 increased by 1.6 percent to its highest level in a month, while the Dow Jones Industrial Average closed 500 points higher. The Nasdaq Composite, which is heavily weighted toward technology, extended gains to 2.2 percent after finishing at a one-month low on Monday, along with the S&P 500.

Netflix Inc. has hit a brick wall following a decade of spectacular growth that rocked Hollywood to its core.
According to a statement released Tuesday, the streaming service lost 200,000 users in the first quarter, the first time since 2011. Additionally, Netflix anticipates losing another 2 million users in the current second quarter, putting the business on track to have its worst year as a public company.
Investors, analysts, and Hollywood executives had anticipated Netflix would announce a slow start to the year, but Wall Street expected the company to add 2.5 million members. The shares, which had already fallen more than 40% this year, fell as much as 24% to $265.11 in after-hours trading.
Netflix management cited four possible explanations, including the widespread usage of password sharing and increased competition. The corporation claims that 100 million households utilize its service without paying for it, in addition to its 221.6 million paying customers. The corporation is experimenting with different methods of registering such viewers.
“Our relatively high home penetration – when combined with the vast number of families that share accounts – combined with competition is causing headwinds for revenue growth,” management noted in a letter to shareholders.
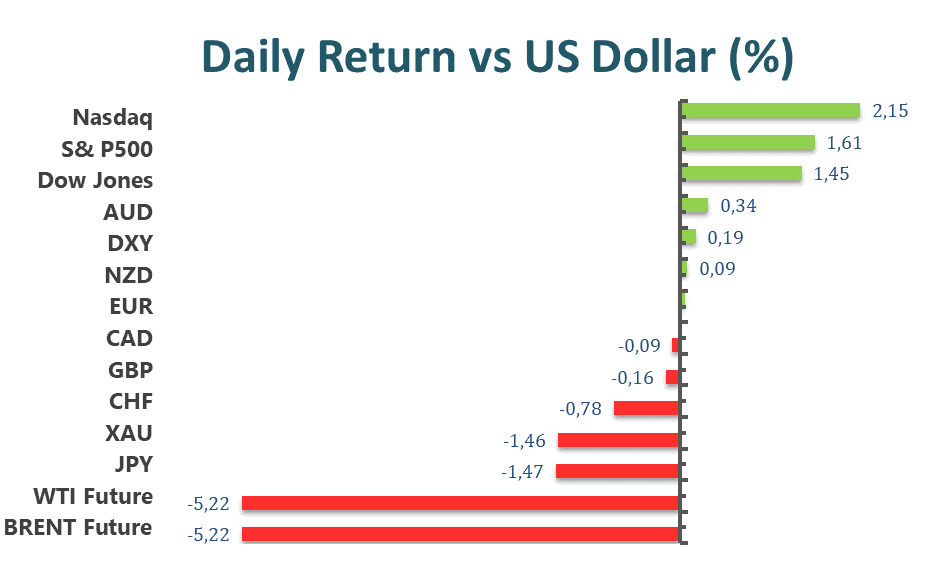
Main Pairs Movement
The Japanese yen was hammered on Tuesday as rising global bond yields increased pressure on G10/Japan interest rate differentials, reducing the attractiveness of the low-yielding safe-haven currency as an investment. Needless to say, the yen was the worst-performing major G10 currency, with USD/JPY soaring about 1.4 percent to its highest level since early 2002 in the upper 128.00s.
EUR/USD and GBP/USD both traded roughly flat near 1.0800 and 1.3000, respectively, despite the return of normal European flows following Monday’s Easter holiday closures. On Tuesday, relevant fundamental data, as well as updates on the Russia-Ukrainian war, were scarce, resulting in lethargic trading conditions.
Finally, the antipodes remained rather calm. The Australian dollar is a minor G10 outperformer following Tuesday’s slightly hawkish RBA minutes release, in which the bank underlined elevated projected inflationary pressures and suggested an early rate hike. The AUD/USD pair recovered roughly 0.4 percent to the 0.7375 regions, having rallied off the 0.7340s 50-Day Moving Average. Meanwhile, NZD/USD traded flat at around 0.6730, remaining near to the more than one-month lows reached on Monday at just around 0.6700.
Technical Analysis
USDJPY (4-Hour Chart)
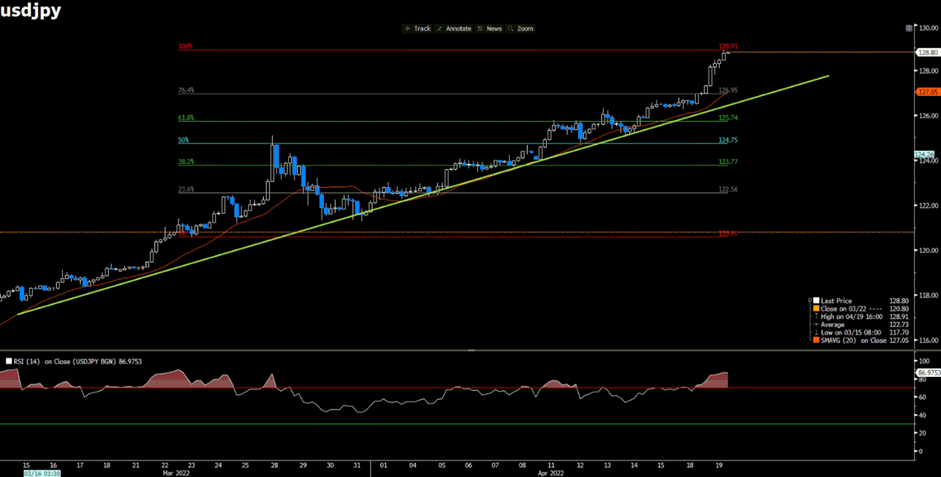
USDJPY surges toward 128.80 on Fed-BOJ divergence, following the US Fed, which is more aggressive and hawkish while the BOJ is positive on a weak Japanese Yen. From the technical perspective, the outlook of USDJPY is certainly positive and bullish as it continues to trade aggressively above the ascending trendline. Despite the RSI indicator being way overbought, the fundamental point of view outweighs the technical indicator. On the flip side, USDJPY needs to decline below 125.74 in order to calm the current bullish momentum; any meaningful declines might attract some sellers for a technical correction.
Resistance: 128.91
Support: 126.95, 125.74, 124.750
XAUUSD (4-Hour Chart)

Gold is down on Tuesday, trading at around $1,955 after hitting nearly $2,000 per ounce on Monday. The demand for gold declines as the greenback is on the back of hawkish comments from the US Fed, saying that the possibility of a 75 bps interest rate hike. From the technical perspective, in the four-hour chart, chances are on the downside as the price has dropped below the bullish trendline and the midline of the Bollinger band. In the meantime, the RSI indicator has not yet reached the oversold territory, currently at 36 readings, meaning that the deportation of bulls is possible. A bearish continuation could be expected on a break below the support at $1,950.
Resistance: 1975. 2001
Support: 1950, 1916
EURUSD (4-Hour Chart)
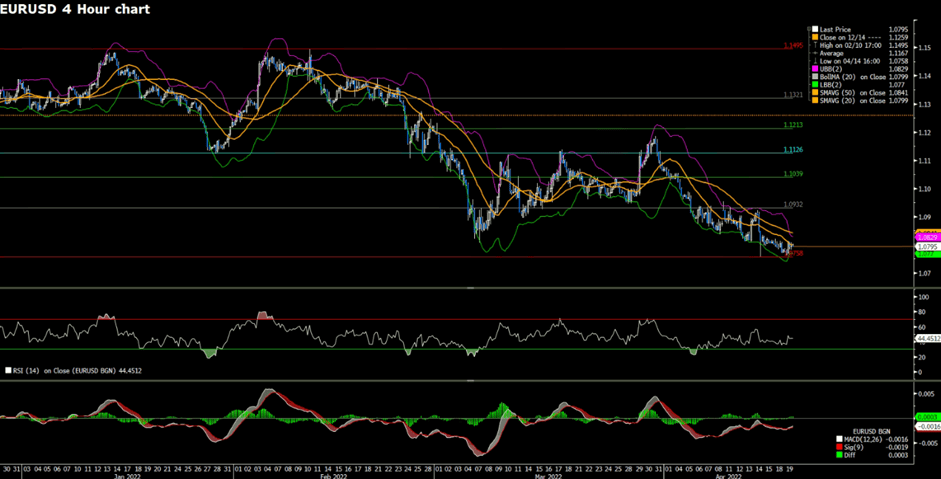
EURUSD clings to a small recovery near 1.0800 on Tuesday after reaching near multi-month lows. Technically speaking, the outlook of the EURUSD remains on a bearish path; in the four-hour chart, despite turning positive intraday, EURUSD is still far below the bearish moving averages. At the same time, the RSI indicator remains within negative levels while the MACD continues to hover around the negative territory, suggesting that EURUSD remains pressured. In order to regain traction in the near- term, EURUSD at least needs to climb above the 20 SMA, then aims for the next hurdle at 1.0932. Otherwise, today’s positive move could be viewed as a technical correction.
Resistance: 1.0932, 1.1039, 1.1126
Support: 1.0758
Economic Data
| Currency | Data | Time (GMT + 8) | Forecast |
| CNY | PBoC Loan Prime Rate | 09:15 | N/A |
| CAD | Core CPI (MoM) (Mar) | 20:30 | N/A |
| USD | Existing Home Sales (Mar) | 22:00 | 5.8M |
| USD | Crude Oil Inventories | 22:30 | 0.863M |