


Daily market analysis
March 11, 2022
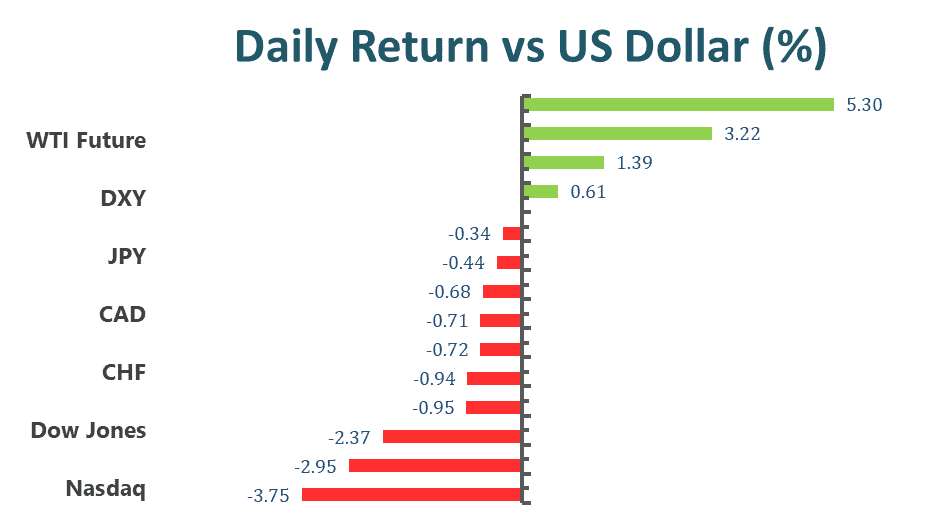
US and EU equity markets closed lower after the peace talks between Russia and Ukraine failed to provide a specific outcome, thus making investors concerned. Moreover, the US CPI for February rose 7.9%, the highest since 1982. The Dow Jones dipped 112.18 points and the S&P 500 slid 0.4%; the Nasdaq Composite declined 1%. In Europe, DAX 40 shed nearly 3% at the end of the day.
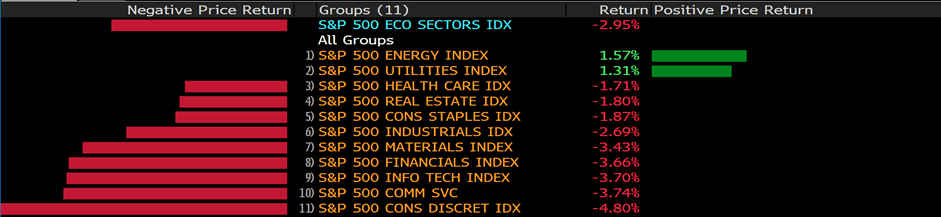
Markets seemed to move inversely and tie closely to the conflict and energy prices since late February. The equity markets slid hard in response to the surging prices of crude oil; the crude oils have risen more than 15% since then. Oil prices have cooled off in the past two days, that was the time when equity markets bounced back a bit.
Goldman Sachs Group Inc. and JP Morgan Chase& Co both have announced they are going to unwind businesses with Russia, becoming the first two major banks to exit Russia. It will become difficult to operate in Russia for Western financial institutions due to the wild sanctions against Russia. At the moment, European banks have not yet declared their decisions as they are the most highly exposed to Russia compared with US banks; however, US banks still have significant exposure, approximately 14.7 billion.
Main Pairs Movement
Gold climbed slightly, but still traded below $2,000 on Thursday. Gold was up as high as $2,009, then it ended up with $1,996 as the European Central Bank announced that it is moving ahead with plans to end its bond-buying programs amid rising inflation.
EURUSD witnessed a volatile day in the red, trading in the 1.0990 price zone. The eurodollar was once up 140 pips but later lost traction after the US reported the February CPI, hitting a multi-decade high of 7.9%. The markets had put speculative interest on the US dollar on an even more aggressive US Fed.
WTI crude oil prices renewed intraday low, trading below $110 per barrel, as Saudi Arabia tamed oil production fears. At the same time, UAE is looking to push for larger output increases from OPEC+ and Iraq is also ready to produce more.
Technical Analysis
GBPUSD (Daily Chart)
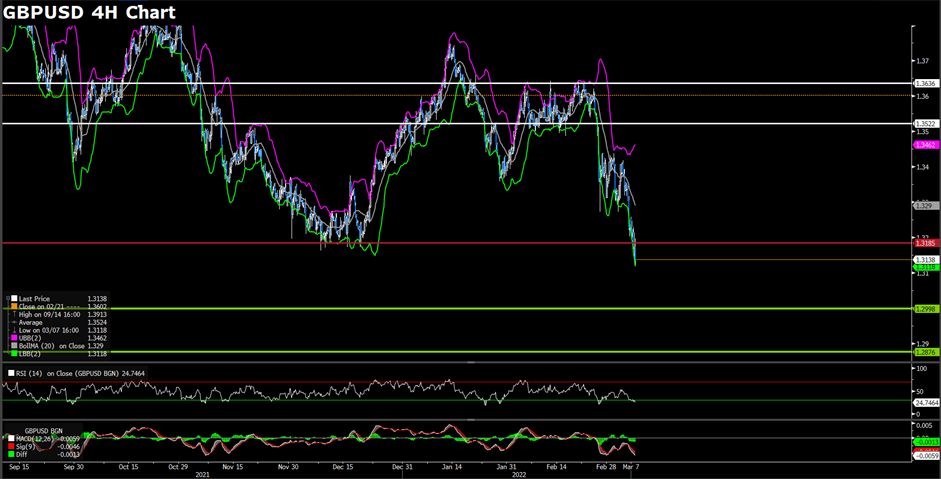
After a sharp shift in risk sentiment from the previous day, market participants have resumed cautious trading ahead of another round of peace talks between Ukraine and Russia. The dollar gained back some ground after the Dollar Index dropped more than 1% from the previous trading day. On the economic docket, the UK is due to release its GDP figures and manufacturing production numbers.
On the technical side, Cable was stopped at our projected resistance level at 1.3185. The support level at 1.3096 holds firm. RSI for Cable sits at 39.99, as of writing. Cable is currently trading below its 50, 100, and 200 days SMA.
Resistance: 1.3185
Support: 1.2998, 1.2876
EURUSD (4-Hour Chart)
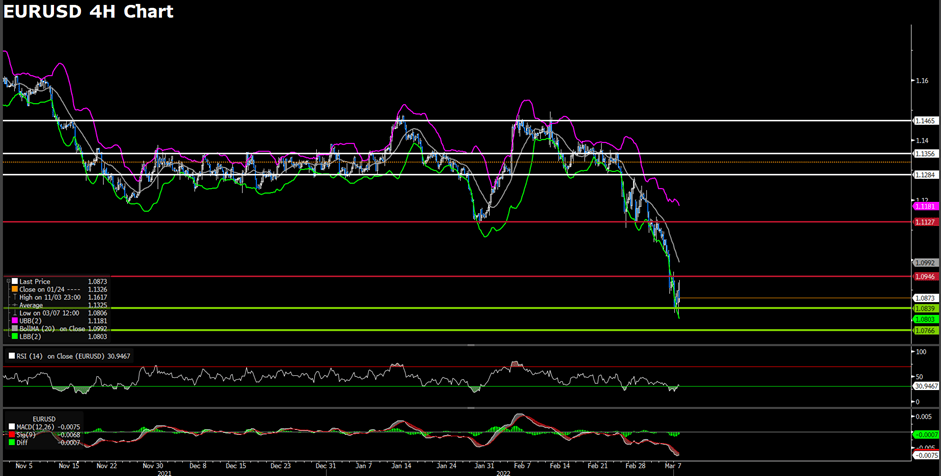
The ECB did not change much on its monetary policy, but the central bank did reiterate its firm stance on ending the asset purchase program by the end of March. The ECB has also noted that while it has refrained from raising interest rates any time soon, shall the central bank’s 2% inflation target become unattainable the central bank would consider all possible measures. A strong recovery from U.S. equity markets and rising U.S. treasury bond yields have buoyed the Dollar across the board.
On the technical side, the resistance level at 1.1127 still stands firm and support levels remain unchanged. RSI for the pair sits at 51.31, as of writing. EURUSD is currently trading below its 50, 100, and 200 days SMA.
Resistance: 1.1127
Support: 1.0839, 1.0766
XAUUSD (4-Hour Chart)
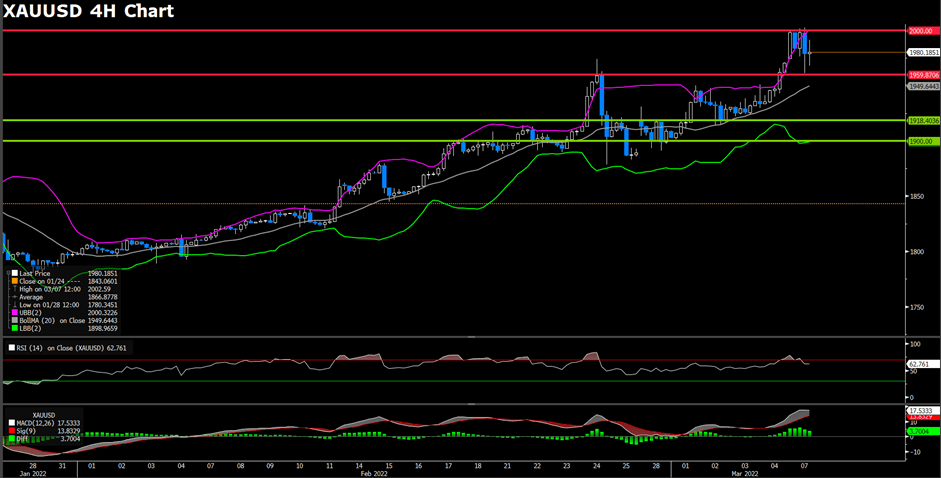
Gold continues to face selling pressure after dropping more than $60 per ounce over the previous trading day; however, market participants seem to have rotated bank into safe-haven assets as Gold recovered from its intraday low. As of writing, XAUUSD is consolidating around the $2000 per ounce price region. A new round of peace talks between Russia and Ukraine is set to begin soon, market participants will be closely observing the results that come out of these talks.
On the technical side, the support level at $2000 seems to be weakened but is still holding, while the resistance level at $2052 stands firm. RSI for XAUUSD sits at 52.5, as of writing. XAUUSD is currently trading above its 50, 100, and 200 days SMA.
Resistance: 2052
Support: 2000, 1982
Economic Data
| Currency | Data | Time (GMT + 8) | Forecast |
| GBP | GDP (YoY) | 15:00 | 9.3% |
| GBP | GDP (MoM) | 15:00 | 0.2% |
| GBP | Manufacturing Production (Jan) | 15:00 | 0.2% |
| GBP | Monthly GDP 3M Change | 15:00 | 0.8% |
| EUR | EU Leaders Summit | 18:00 | – |
| CAD | Employment Change (Feb) | 21:30 | – |
-
Global - English

-
United Kingdom - English
-
France - Français

-
Spain - Español

-
Portugal - Português

-
Italy - Italiano

-
Germany - Deutsch

-
Turkey - Türkçe

-
MENA - العربية

-
MENA - English
-
Asia - English
-
India - English

-
Indonesia - Indonesia

-
Japan - 日本語

-
South Korea - 한국어

-
Malaysia - Bahasa Malaysia

-
Malaysia - English
-
Philippines - English

-
Vietnam - Tiếng Việt

-
Thailand - ไทย

-
China - 简体中文

-
China - 繁體中文

This site uses cookies to provide you with a great user experience.
By using vtmarkets.com, you accept
our cookie policy.
Start trading with
VT Markets today


![]()
Follow us on:


![]()


