


Daily market analysis
January 28, 2022
Market Focus
Wall Street faced another choppy day on Thursday, with all
three major indexes closing lower, battered by uncertainty in recent days, with more fluctuations and heightened volatility. The S&P 500 pared intraday gains and ended lower as investors appeared to be bracing for a faster pace of interest rate hikes by the Federal Reserve, sending Tesla shares tumbling and a slump in chip stocks led by Intel dragging the broader market. In addition, against this hawkish backdrop, positive economic news, mixed corporate earnings and geopolitical turmoil also weighed on investors. At the end of the market, the Dow Jones Industrial Average fell 0.02 % to 34,160.78 points, the S&P 500 index lost 0.54% to 4,326.51 and the Nasdaq Composite Index dropped 1.4% to 13,352.78 points
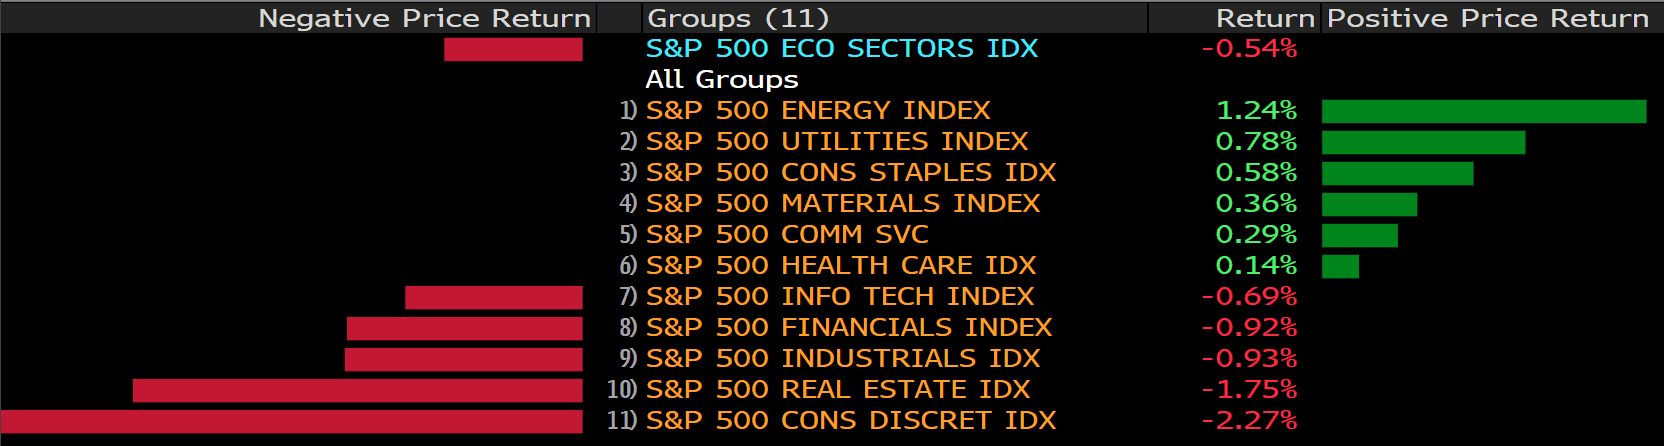
Five of the 11 sectors in the S&P 500 ended lower, with the consumer discretionary sector down the most, dropped 2.27%, followed by the real estate sector, down 1.75%. The biggest winner was the energy sector, up 1.24%. A number of companies reported earnings this week, Tesla reported better-than-expected quarterly results but warned that supply chain issues could affect production this year, sending its shares down more than 11%. Meanwhile, Intel closed down more than 7% as better-than-expected quarterly results were overshadowed by concerns that higher investment costs would weigh on growth. On the other hand, Apple rose more than 2% in post-market after the iPhone maker beat earnings estimates and Netflix jumped 7.5% on the news that billionaire investor William Ackman was adding a new $1 billion stake in the company.
Main Pairs Movement:
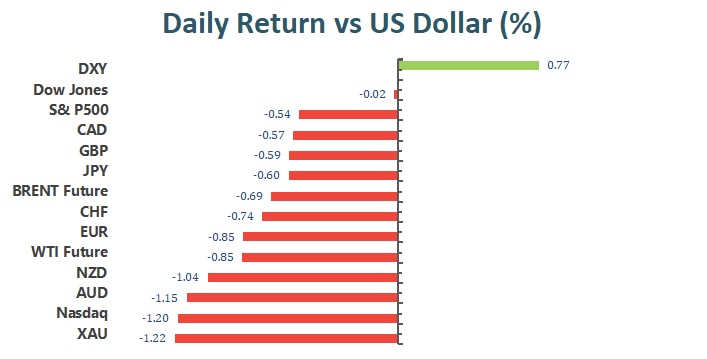
Markets were all focused on the dollar and the Fed after the Fed all but confirmed a rate hike in March, fueling speculation of at least four rate hikes this year. The dollar was further supported by upbeat growth data, with GDP rising 6.9% in the fourth quarter, much better than the 5.5% expected. Meanwhile, initial jobless claims for the week hit 260K, in line with expectations. At the end, the U.S. dollar index rose 0.75% to 97.204, a fresh year-to-date high and close to the July 2021 high.
The greenback extends post-Fed rally to multi-month highs, the pound and euro continued to weaken and head further south, down 0.57% and 0.85%, respectively. AUD/USD hit a one-week low of 0.7030, while USD/CAD moved further north to 1.2730 and USD/JPY settled at 115.368.
Gold was the worst performer, down another 1.22% and closed at 1,797.48 per ounce. Crude oil continued to move north and rose to new multi-year highs, with WTI closing at $86.80 a barrel and Brent at $89.88 a barrel.
Technical Analysis:
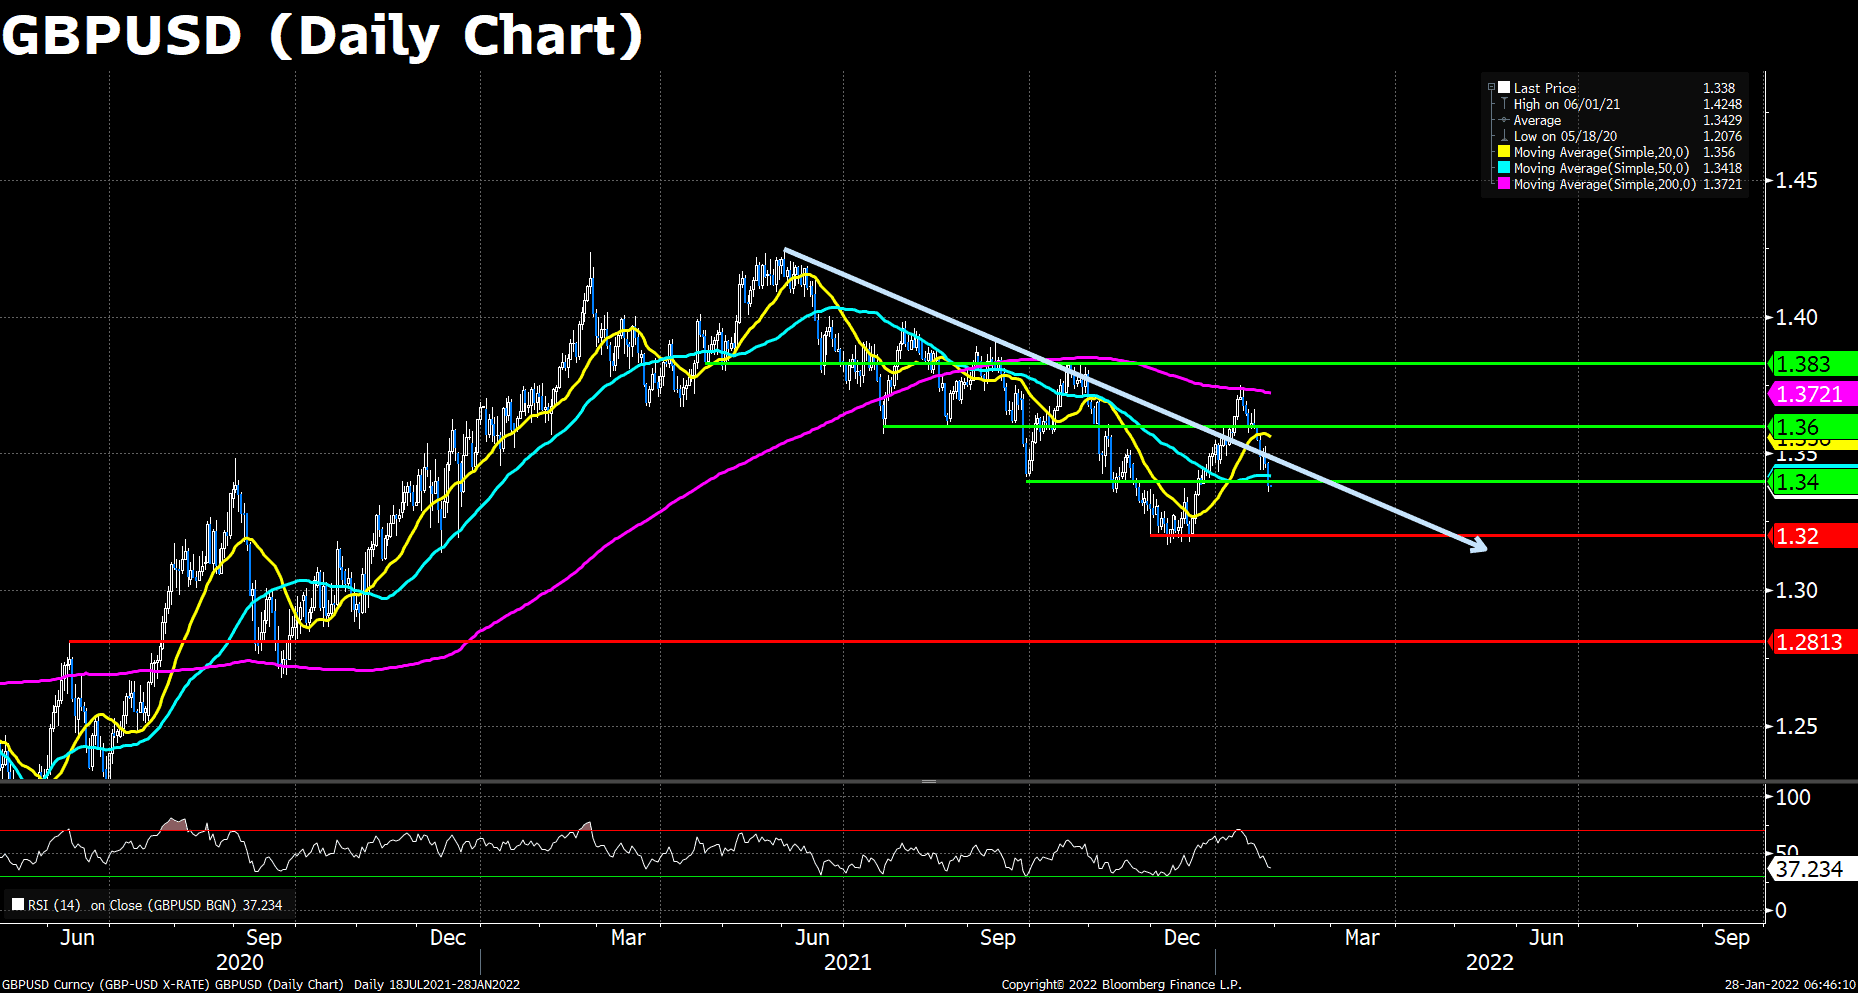
GBP/USD fell to one-month lows on Thursday underneath the 1.3400 level after slumping below resistance in the 1.3450 area earlier in the session, weighed by a buoyant dollar in wake of Wednesday’s hawkish Fed meeting and strong US GDP data. The pair is now consolidating in the 1.3380 area, lowered by about 0.6% on the day. Those losses, though extensive, are modest compared to many of sterling’s G10 peers, as investors expect the BoE to lift interest rates by 25bps to 0.25% next Thursday following strong labour market and inflation data for December.
On the technical front, the GBP/USD pair is downward biased, with the RSI sliding further to 37.23 during today’s slump, and the long-term downtrend weighing on the pair’s traction. The price actions dropped below all its major moving averages, suggesting that the Pound might keep capping by the dollar’s strength in the near term. To the downside, the next support for the pair lies around 1.3200, followed by 1.2800, a price last since at October 2020.
Resistance: 1.3400, 1.3600, 1.3830
Support: 1.3200, 1.2800

The EUR/USD pair fell on Thursday to 1.1130, a level that was last seen in May 2020. The dollar appreciated through all sessions, surging in Asia on the back of a hawkish US Federal Reserve and hints for a rate hike in March coming from chief Jerome Powell himself. The greenback gained additional momentum after the US reported its annualized quarterly growth, as the Gross Domestic Product surpassed expectations in Q4 2021 by printing 6.9%. Looking forward, Germany will release the preliminary estimate of its Q4 GDP, while the EU will publish the January Economic Sentiment Indicator on Friday.
As to technical, the pair has collapsed below all of its moving averages, while the Momentum indicator heads south almost vertically, approaching oversold levels. The RSI indicator, in the meantime, maintains its bearish slope at around 32.65. To the downside, the next support level for the pair will appear at around 1.1000, followed by 1.0780.
Resistance: 1.2000, 1.4000, 1.6200
Support: 1.1000, 1.0780
XAUUSD (Daily Chart)
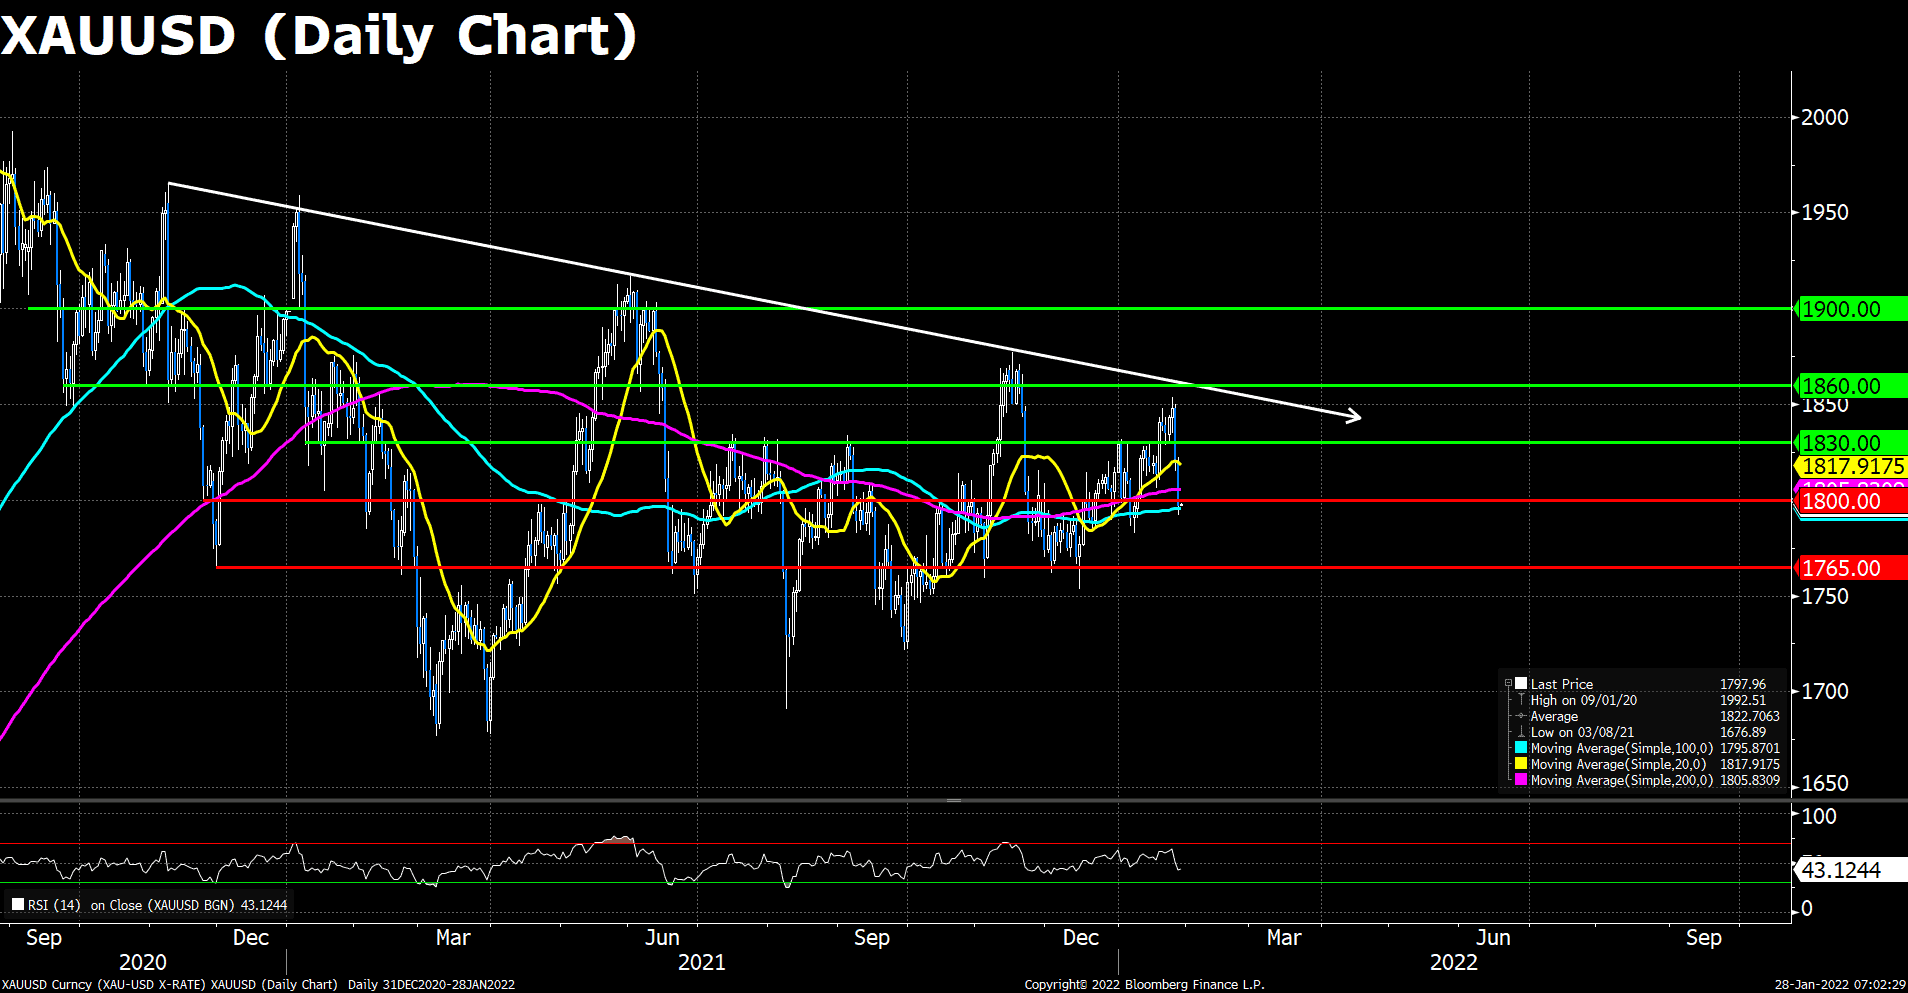
After pulling back sharply on Wednesday from the $1850 highs to a sub-$1820 close amid hawkish post-Fed meeting vibes, gold price have continued to decline, with pretty much the same harsh pace on Thursday. XAU/USD is currently trading close to the $1,797 a troy ounce, down a further 1.25% and now down about 2.86% from Tuesday’s highs above $1850. Gold was pressured by the DXY broking out to fresh 19-month highs above the 97.00 level, and as major US yields broke out to fresh cycle highs, markets moved to price in more aggressive Fed hikes.
From the technical perspective, gold pared all of its gains this week and even dived further below the key $1,800 threshold. The pair penetrated all its major moving averages, and the RSI indicator retreated back to the average line during Thursday’s trades. Moreover, the long-term downward trendline leaves the yellow metal under downside risk. To the upside, the previous support $1,830 would be a fresh resistance for the yellow metal, followed by $1,860; on the flip side, gold’s first support is at $1,800. A breach of the latter would expose the next support at around $1,765, where the November lows sit.
Resistance: 1830, 1860, 1900
Support: 1800, 1765
Economic Data:
|
Currency |
Data |
Time (GMT + 8) |
Forecast |
|
|
EUR |
German GDP (QoQ) (Q4) |
17:00 |
-0.3% |
|
-
Global - English

-
United Kingdom - English
-
France - Français

-
Spain - Español

-
Portugal - Português

-
Italy - Italiano

-
Germany - Deutsch

-
Turkey - Türkçe

-
MENA - العربية

-
MENA - English
-
Asia - English
-
India - English

-
Indonesia - Indonesia

-
Japan - 日本語

-
South Korea - 한국어

-
Malaysia - Bahasa Malaysia

-
Malaysia - English
-
Philippines - English

-
Vietnam - Tiếng Việt

-
Thailand - ไทย

-
China - 简体中文

-
China - 繁體中文

This site uses cookies to provide you with a great user experience.
By using vtmarkets.com, you accept
our cookie policy.
Start trading with
VT Markets today


![]()
Follow us on:


![]()


