Market Focus
U.S. equity markets continue to be turbulent ahead of FOMC’s press conference scheduled on the 27th. The Dow Jones industrial average lost 0.19% to close at 34,297.73, the S&P 500 slid 1.22% to close at 4,356.45 and the Nasdaq composite slumped 2.28% to close at 13,539.29. All three major equity indices experienced a sharp sell of to start the session, but saw quick recovery mid-session and then were faced with another correction towards the close. The benchmark U.S. 10 year treasury yield slid slightly to 1.778%, while the 30 year treasury yield sits at 2.124%.
Microsoft released better than expected earnings after the bell. Microsoft’s revenue increased by 20% year over year in the quarter, and net income surged by 21% to $18.77 billion. Despite better than expected operating result, shares of Microsoft traded lower during the session but is positive after earnings release.
Johnson & Johnson reported 4th quarter sales of $24.8 billion and 2021 full fiscal year sales of $93.8 billion, a growth of 13.6% growth year over year.
Tesla is due to release earnings on the 26th.
Main Pairs Movement:
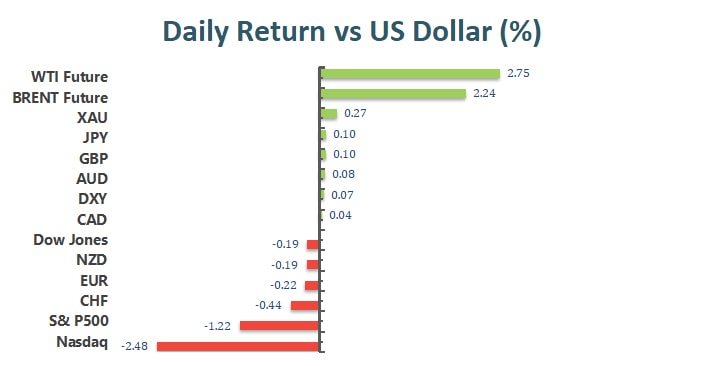
The Dollar index gained 0.1% over the course of yesterday’s trading and the index has recovered all the lost ground since January 11th. Dollar strength could be the reflect of market participant’s anticipation ahead of the FOMC’s press conference.
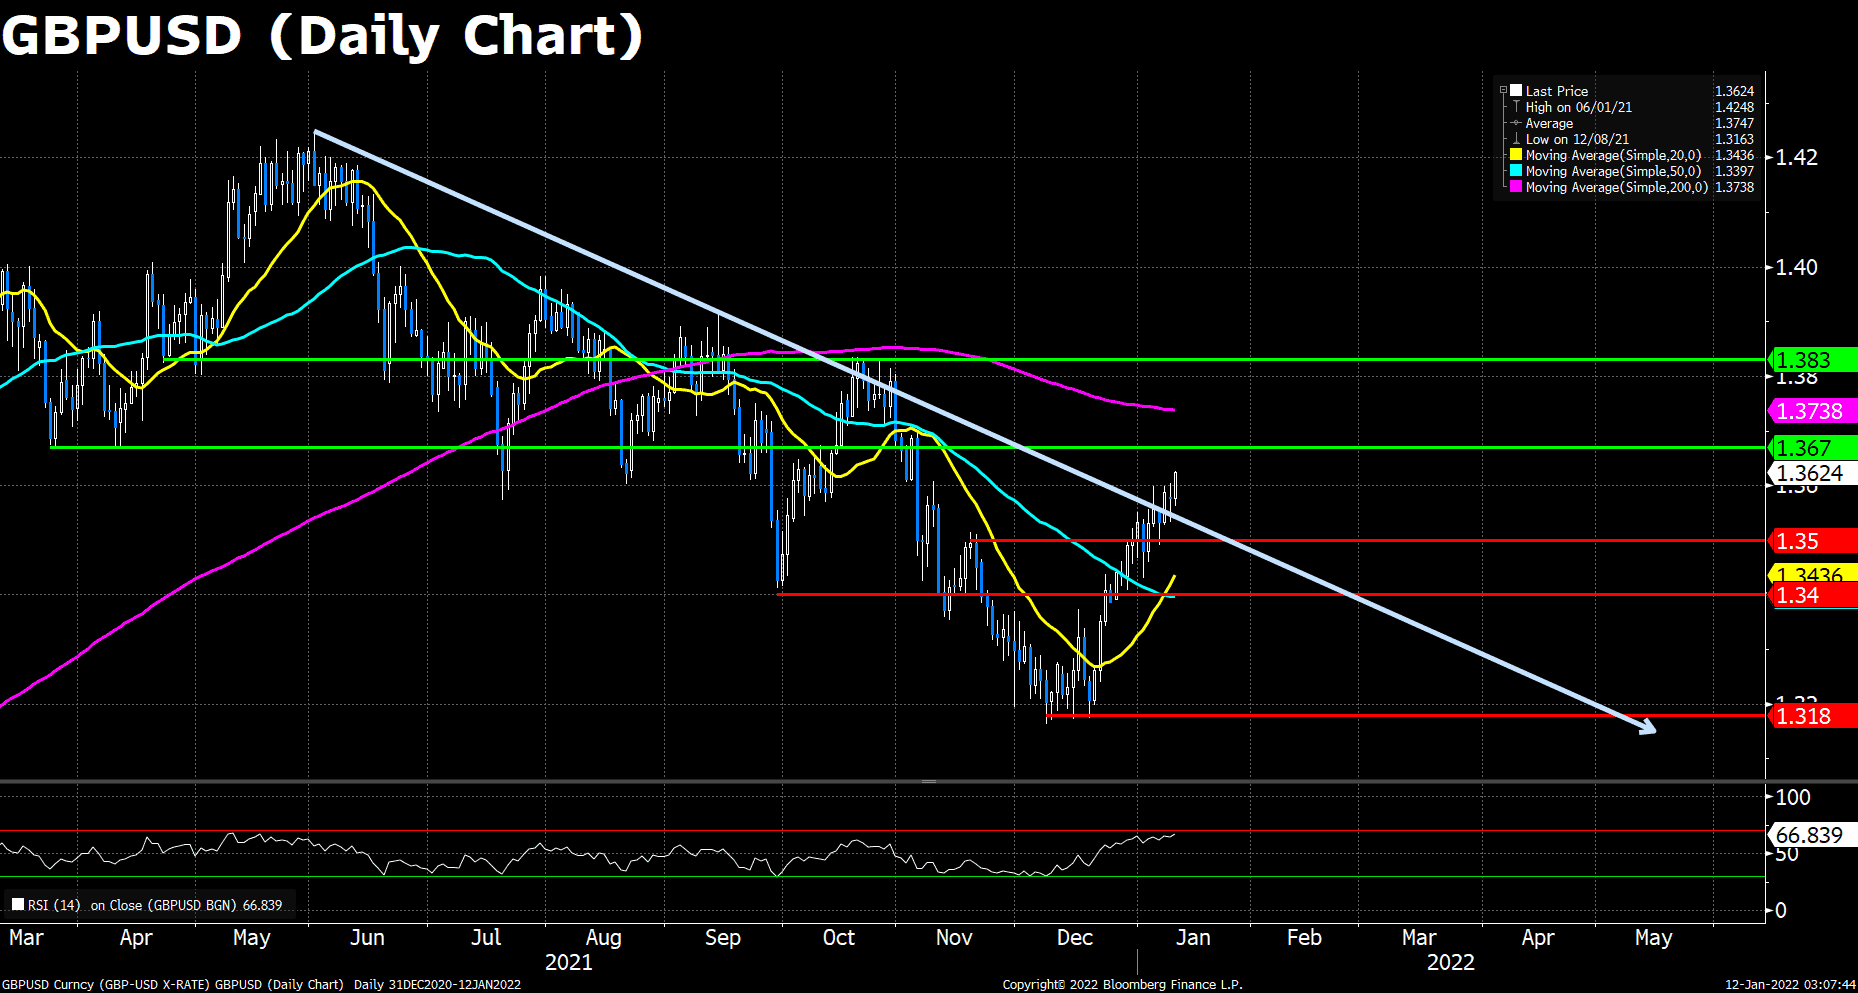
Cable gained a modest 0.05% during yesterday’s trading. A second straight session of gains for the Sterling. If the 1.348 support level continues to hold, Cable could finally break out of its yearlong downward trend.
The Euro continues to trade lower against the dollar. The EURUSD pair lost 0.21% over the course of yesterday’s trading and saw an intraday low of 1.126, but the pair was able to recover once the U.S. session began.
Gold continues its rise as global inflation sentiment remains high. The FOMC’s rate decision could bring tremendous price action to the previous metal. $1867 presents itself as the nearest resistance level for XAUUSD.
Technical Analysis:
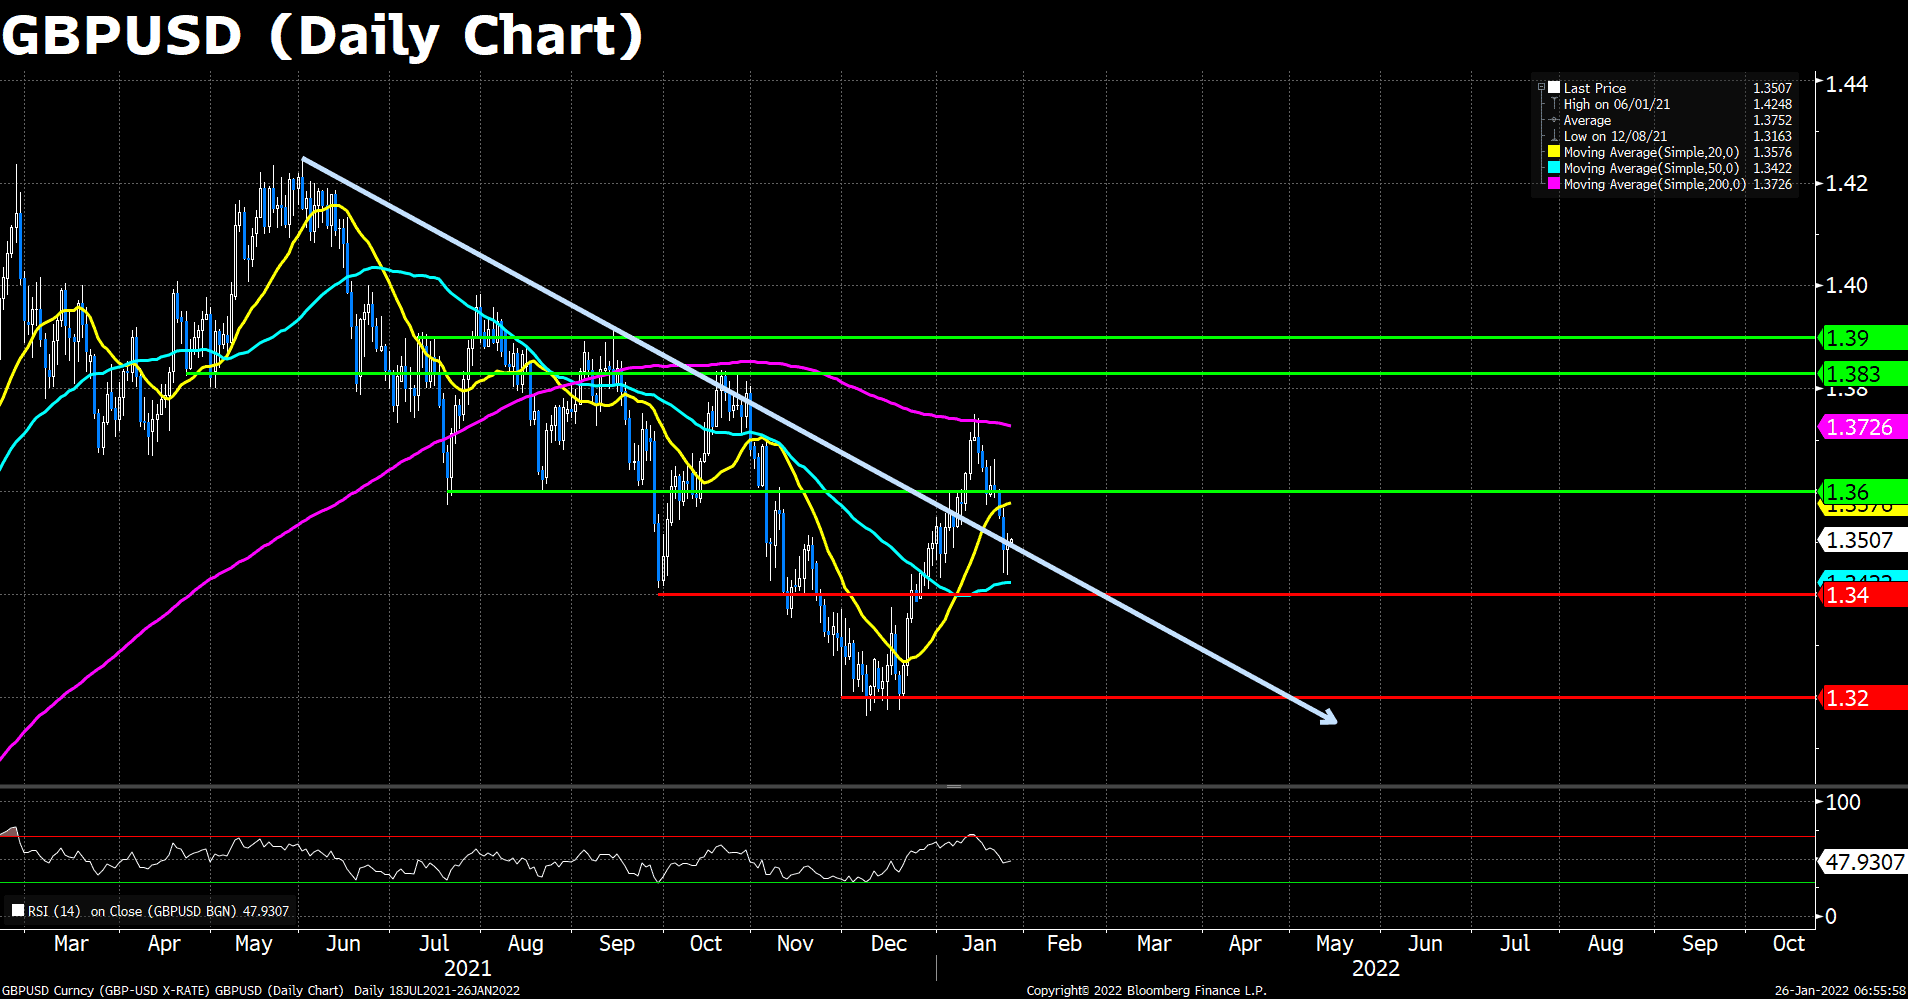
Seesawing around 1.3500, GBP/USD is flat but turning green on the day following a recovery from the lows of 1.3436 and retesting the previous downtrend resistance. The US dollar has fallen under pressure as the 10-year yields remain capped by dismal market mood. Meanwhile, the markets are in high anticipation of the Federal Reserve interest rate decision and accompanying statement. The fundamental outlook for the UK remains unclear.
On the technical front, earlier in the US session, 1.3500 was noted as an anchor point from which bulls would be expected to struggle to pull away from. However, a key level of resistance was penetrated and a higher high for the day was scored all of the way towards 1.3520. At the very end of today’s trading, cable dropped back to near 1.3500 level as the downside pressure enhanced, leaving the day flat.
Resistance: 1..3600, 1.3830, 1.3900
Support: 1.3400, 1.3200
During the first half of the North American session, the EUR/USD pair fell from 1.1325 towards the figure, giving way for USD bulls, who secured a 40-pip move to the daily low of the day at 1.1263. Then, as the New York session progressed later on, EUR bulls entered the market, reclaiming the 1.1300 figure. The slump today attributed to a risk-off market mood that has spurred demand for safe-haven assets. Factors like the Ukraine – Russia crisis and the Fed’s first monetary policy meeting of the year maintain market participants uneasy, as portrayed by US equities trading in the red. At the time of writing, the shared currency is trading at 1.1300.
As to technical, the Euro pair is neutral-downward biased. The 50 DMA moves close to the spot price, leading the way for the longer time-frame ones, with the 100-DMA and the 200-DMA lying at 1.1469 and 1.1708 each. Nevertheless, the bias is downward as long as the exchange rate remains below the former. On the downside, the first support of the pair would appear at the 23.6% Fibonacci, which is around 1.1300, then we have the 2-year lows around 1.1200, which is the last barricade before the pair drops further.
Resistance: 1.1380, 1.1440,1.1500
Support: 1.1300, 1.1200
XAUUSD (Daily Chart)
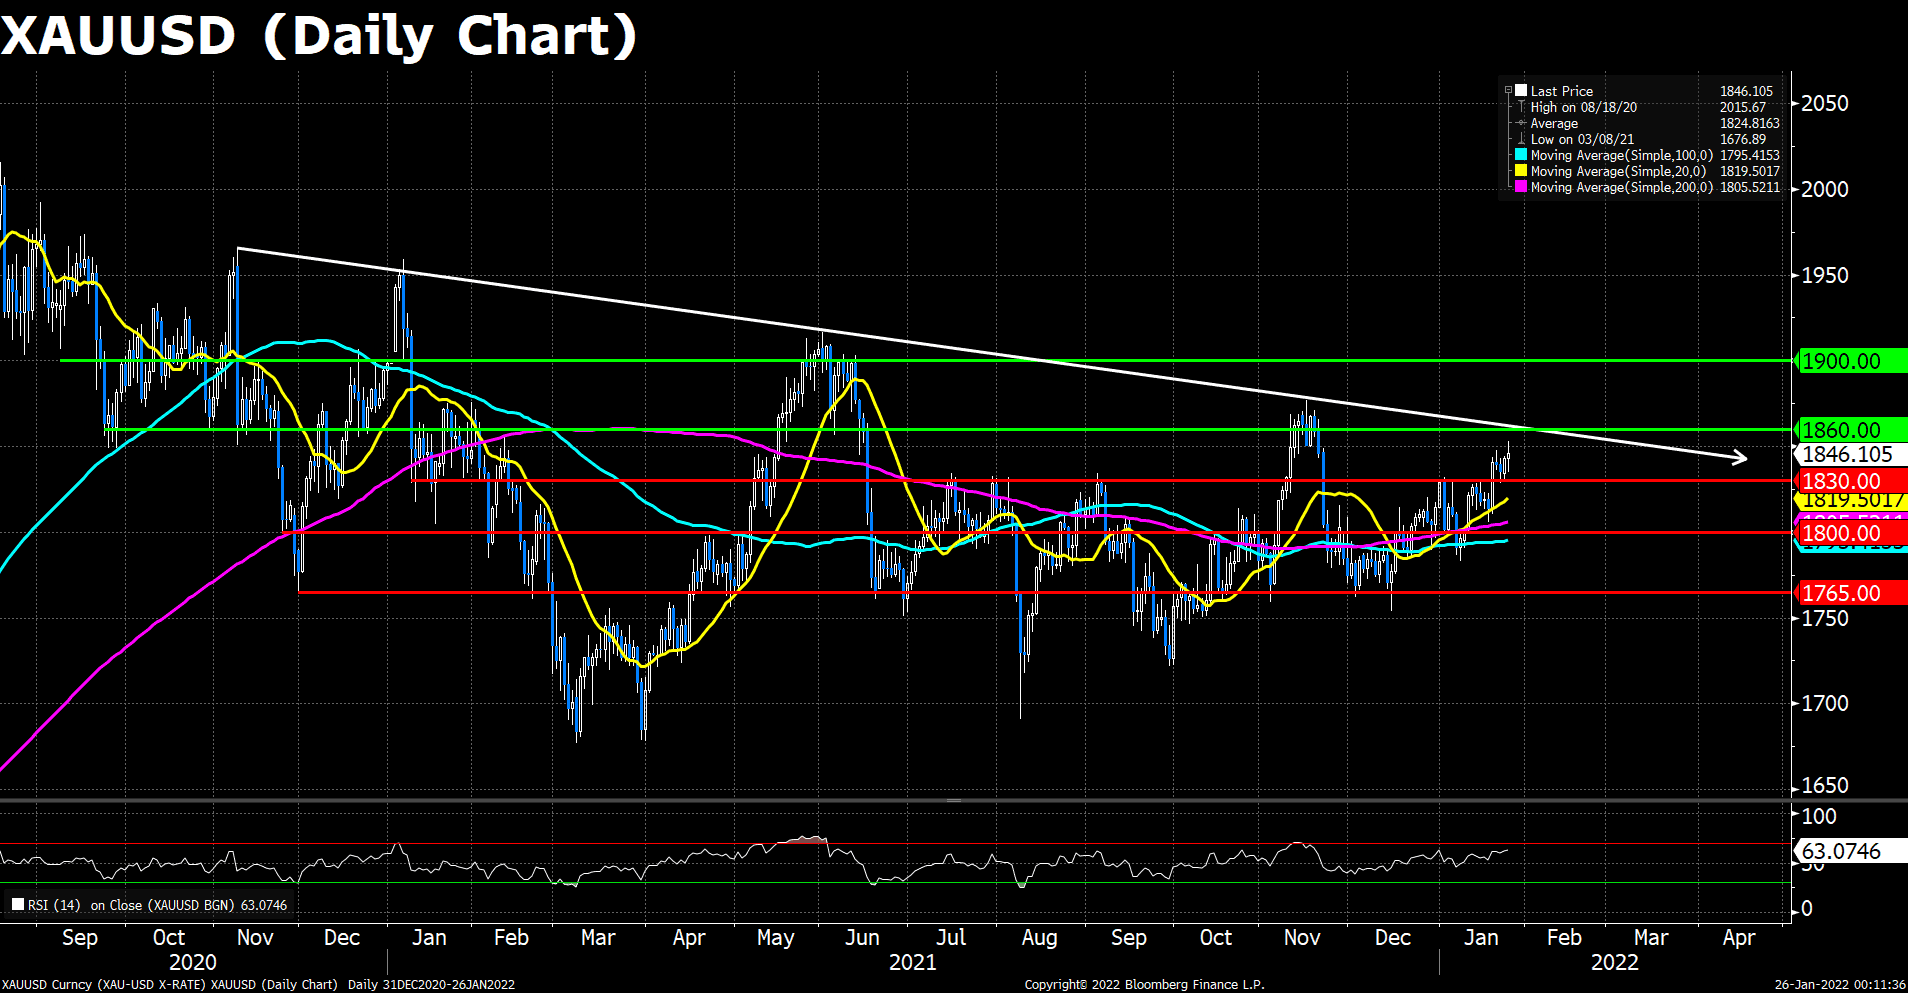
Gold bounced off the $1,850 per troy ounce psychological resistance but fell to the previous price levels afterward. The upside traction of the yellow metal on Tuesday may due to investor’s escalating concerns about the Wednesday’s Fed talks and the crucial Q421 and yearly report of Apple Inc., the world’s largest company by market cap. The pair now trades at $1,846, up 0.2% intraday and the momentum remains strong amid the widespread risk-off sentiments.
From the technical perspective, gold now hovers around the psychological block $1,850. The pair is upside biased, with the major DMAs below the spot price, and a RSI reads showing yet another breach over $1,850 is highly likely to occur later the day. However, the long-lasting downward slope leaves the yellow metal under downside risk. As yesterday mentioned, gold’s first resistance would be at the $1,860s, and then its last summer’s highs at around $1,900; on the other hand, gold’s first support is at $1,830. A breach of the latter would expose the next support at $1,800, followed by the November lows around $1,765.
Resistance: 1860, 1900
Support: 1830, 1800, 1765
Economic Data:
|
Currency |
Data |
Time (GMT + 8) |
Forecast |
|
|
AUD |
Australia – Australia Day |
|||
|
INR |
India – Republic Day |
|||
|
USD |
New Home Sales (Dec) |
23:00 |
760 K |
|
|
CAD |
BoC Monetary Policy Report |
23:00 |
||
|
CAD |
BoC Interest Rate Decision |
23:00 |
0.25% |
|
|
USD |
Crude Oil Inventories |
23:30 |
-0.728 M |
|