


Daily market analysis
November 19, 2021
Market Focus
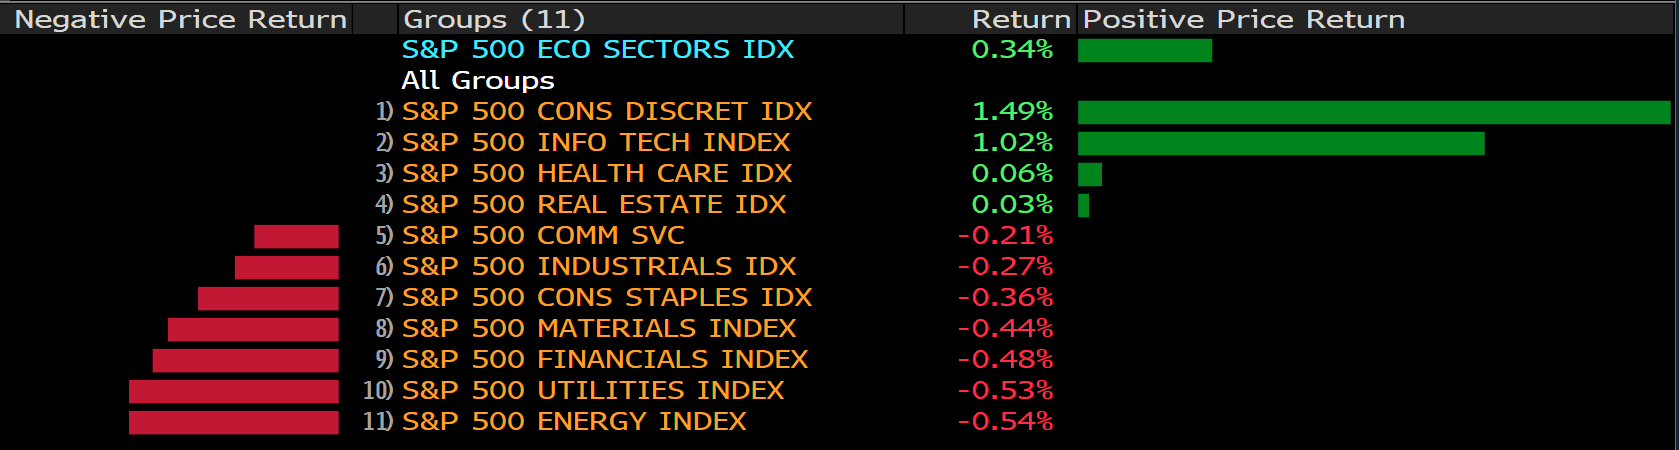
Technology stocks drove the equity market to a record in a volatile session ahead of Friday’s options expiration. S&P 500 notched its 66th all-time high of 2021, with the benchmark gauge poised for the second-biggest number of annual records ever — only behind 1995. Tech-heavy Nasdaq 100 outperformed as giant chipmaker Nvidia Corp. boosted its outlook, while Apple Inc. jumped after Bloomberg News reported the company is pushing to accelerate the development of its electric car. Macy’s Inc. and Kohl’s Corp. paced gains in retailers after signaling consumer demand remains robust. Dow Jones dropped, down 0.17%.
The nonpartisan Congressional Budget Office estimated that President Joe Biden’s signature economic package doesn’t contain enough tax increases to pay for itself — a determination that counters White House claims but may not be enough to sink the bill.
The CBO found that the draft legislation, on which the House plans to vote late Thursday, contains $1.636 trillion of spending, while raising $1.269 trillion in revenue over 10 years. That would add $367 billion to the U.S. budget deficits over the decade.
The score will, however, give ammunition to Republicans — who are already attacking the bill by arguing it will increase inflation, stifle job creation and foster dependency on the government, in addition to saying it will add to the national debt.
A key reason the CBO finds the bill does not pay for itself involves estimates of how much increased tax collection can result from expanding the IRS’s budget. While the White House has projected that increasing the number of enforcement agents at the Internal Revenue Service would yield $400 billion in higher revenue, the CBO does not agree.
Main Pairs Movement:
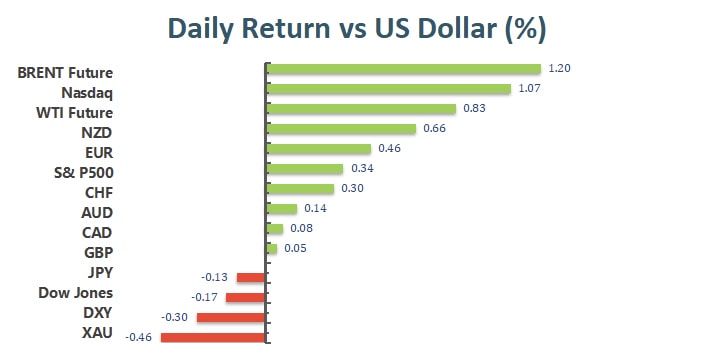
The US dollar continued to lose strength against most of its major rivals during Thursday’s trading hours. The dollar index dropped 0.3% to around 95.50, with EUR regained its lost lands amid the dollar weakness, and the Japanese Yen being the worst performer as the revived risk-on market mood weighed on the save haven.
The Euro pair rebounded from its yearly low, surged 60 pips during the day and trading at 1.1365 at the moment. Cable extended its previous gains, posting a modest 0.06% increase to around the 1.3500 key level. Loonie hovered around 1.2600 throughout the day, while high yielding pairs like Aussie and Kiwi climbed 0.14% and 0.65% respectively. USD/JPY advanced on Thursday after the yesterday’s plummet, closing the day at 114.25.
Gold consolidated around the $1850-70 price levels per troy ounce across the week, the upward momentum seems to come to a halt after last week’s skyrocketing. Crude oil prices posted mild gains, with WTI ending the day red at $78.85 a barrel, and Brent up to $81.05. US yields remained on the familiar levels, with 10-year benchmark unchanged at 1.590.
Technical Analysis:
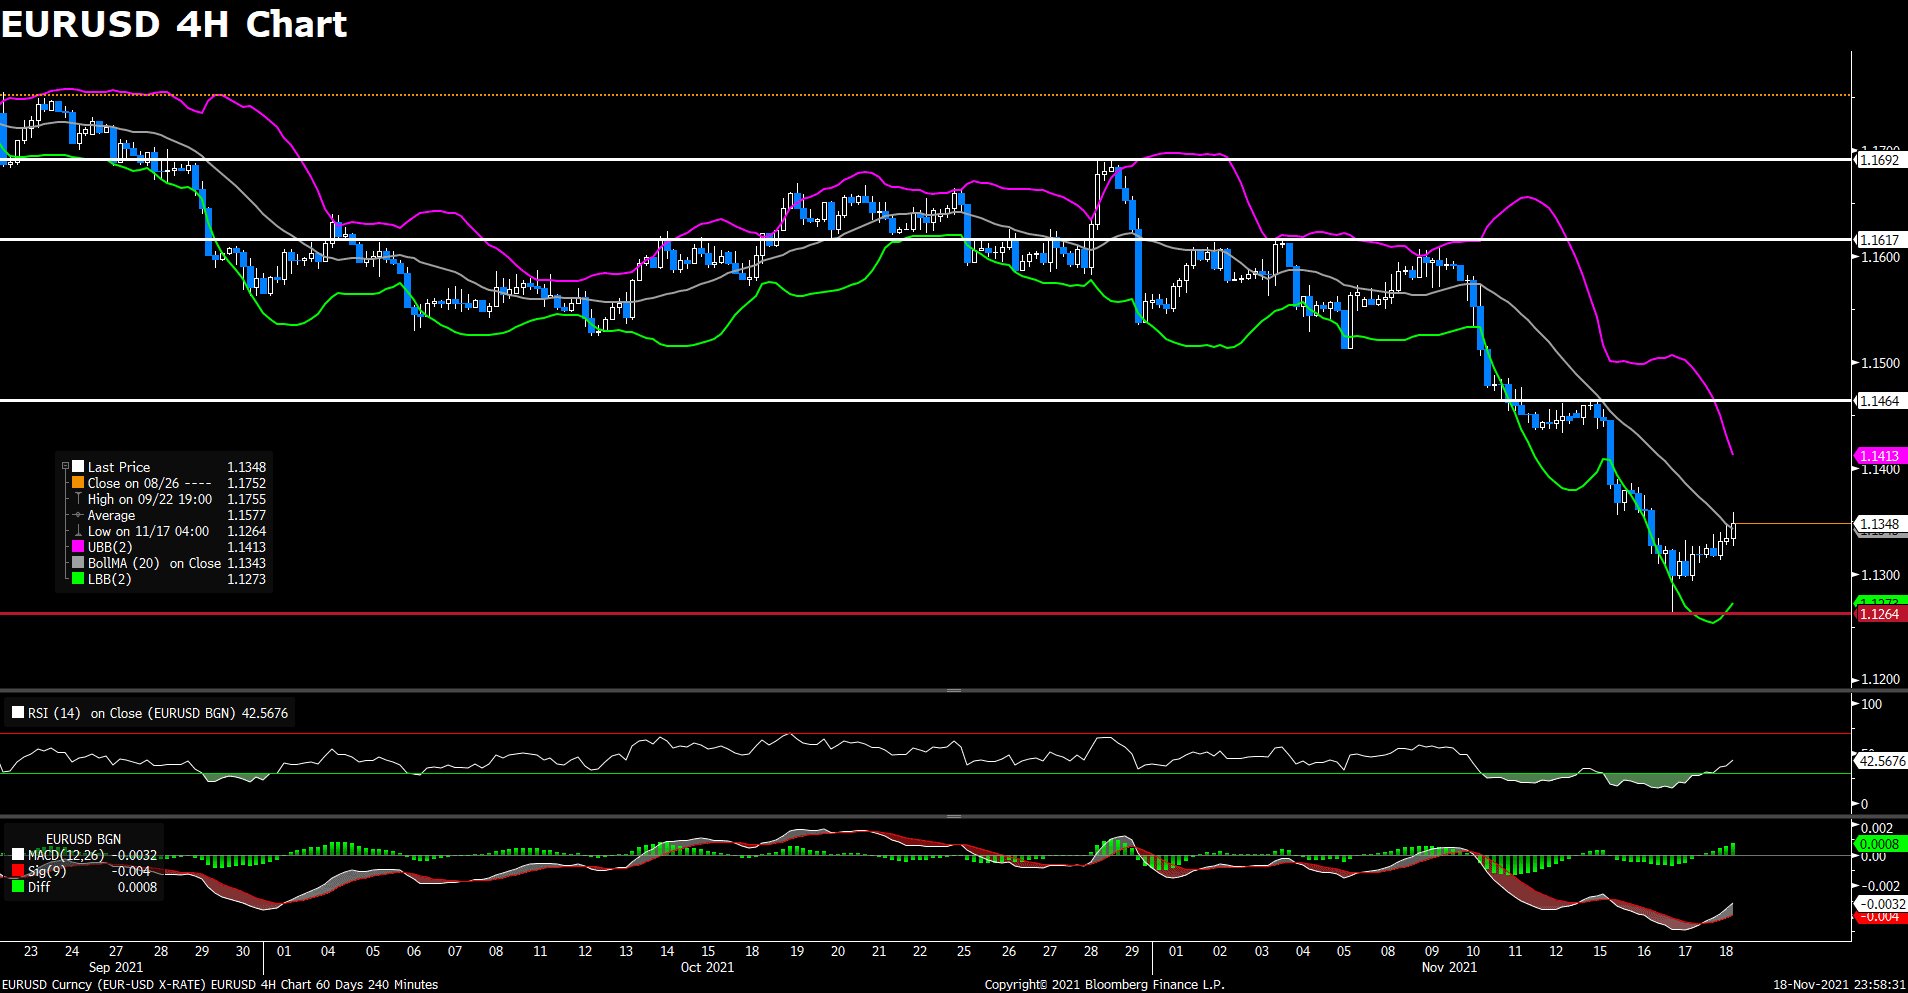
Following previous day’s rebound from 2021 lows near 1.126, the pair EUR/USD continued to see some buying on Thursday amid US dollar weakness. Despite staying in negative territory in late Asian session, the pair regained bullish momentum and extended further after European session started, currently rising 0.32% on a daily basis. The risk-on market sentiment weighed on the safe-haven US dollar and lend some support to the EUR/USD pair. But the better-than-expected US job data limit further gains for the pair, as weekly initial jobless claims falling to a fresh post-pandemic low at 269K. In Eurozone, the rising cases in Covid-19 and yesterday’s dovish ECB comments might cap the upside for the pair.
For technical aspect, RSI indicator 45 figures as of writing, suggesting tepid bear movement ahead. But for the MACD indicator, the MACD is now sitting above the signal line, which indicates a possible upward trend for the pair. Looking at the Bollinger Bands, the price crossed above the moving average after touching the lower band, therefore the upper band becomes the profit target. In conclusion, we think market will be bullish as the pair is eyeing a test of 1.1464 resistance. If price break above that level, the rebound could extend further.
Resistance: 1.1464, 1.1617, 1.1692
Support: 1.1264, 1.1168

The pair GBP/USD edged higher on Thursday, continuing its five-day recovery from a yearly low. The pair touched a daily high in early European session, but then failed to preserve its bullish momentum and dropped toward 1.347 area. The cable starts to see fresh buying at the time of writing, rising 0.05% on a daily basis. Weaker US dollar across the board pushed the cable higher, as sudden changes in the market mood dragged the US 10-year Treasury yield down to 1.582%. In the UK, concerns about the possibility that the UK government would trigger Article 16 of the Northern Ireland Protocol still remained. Meanwhile, the deadlock over the post-Brexit fishing rights also acted as a headwind for the British pound.
For technical aspect, RSI indicator 56 figures as of writing, suggesting bull movement ahead. But looking at the MACD indicator, the positive histogram also indicates a possible downward trend for the pair. As for the Bollinger Bands, the price is moving alongside the upper band, therefore a trend continuation could be expected. In conclusion, we think market will be bullish as the pair is heading to re-test the 1.3607 resistance. A sustained strength beyond the 1.3500 level could attract bulls to position further appreciating move for the GBP/USD pair.
Resistance: 1.3607, 1.3698, 1.3835
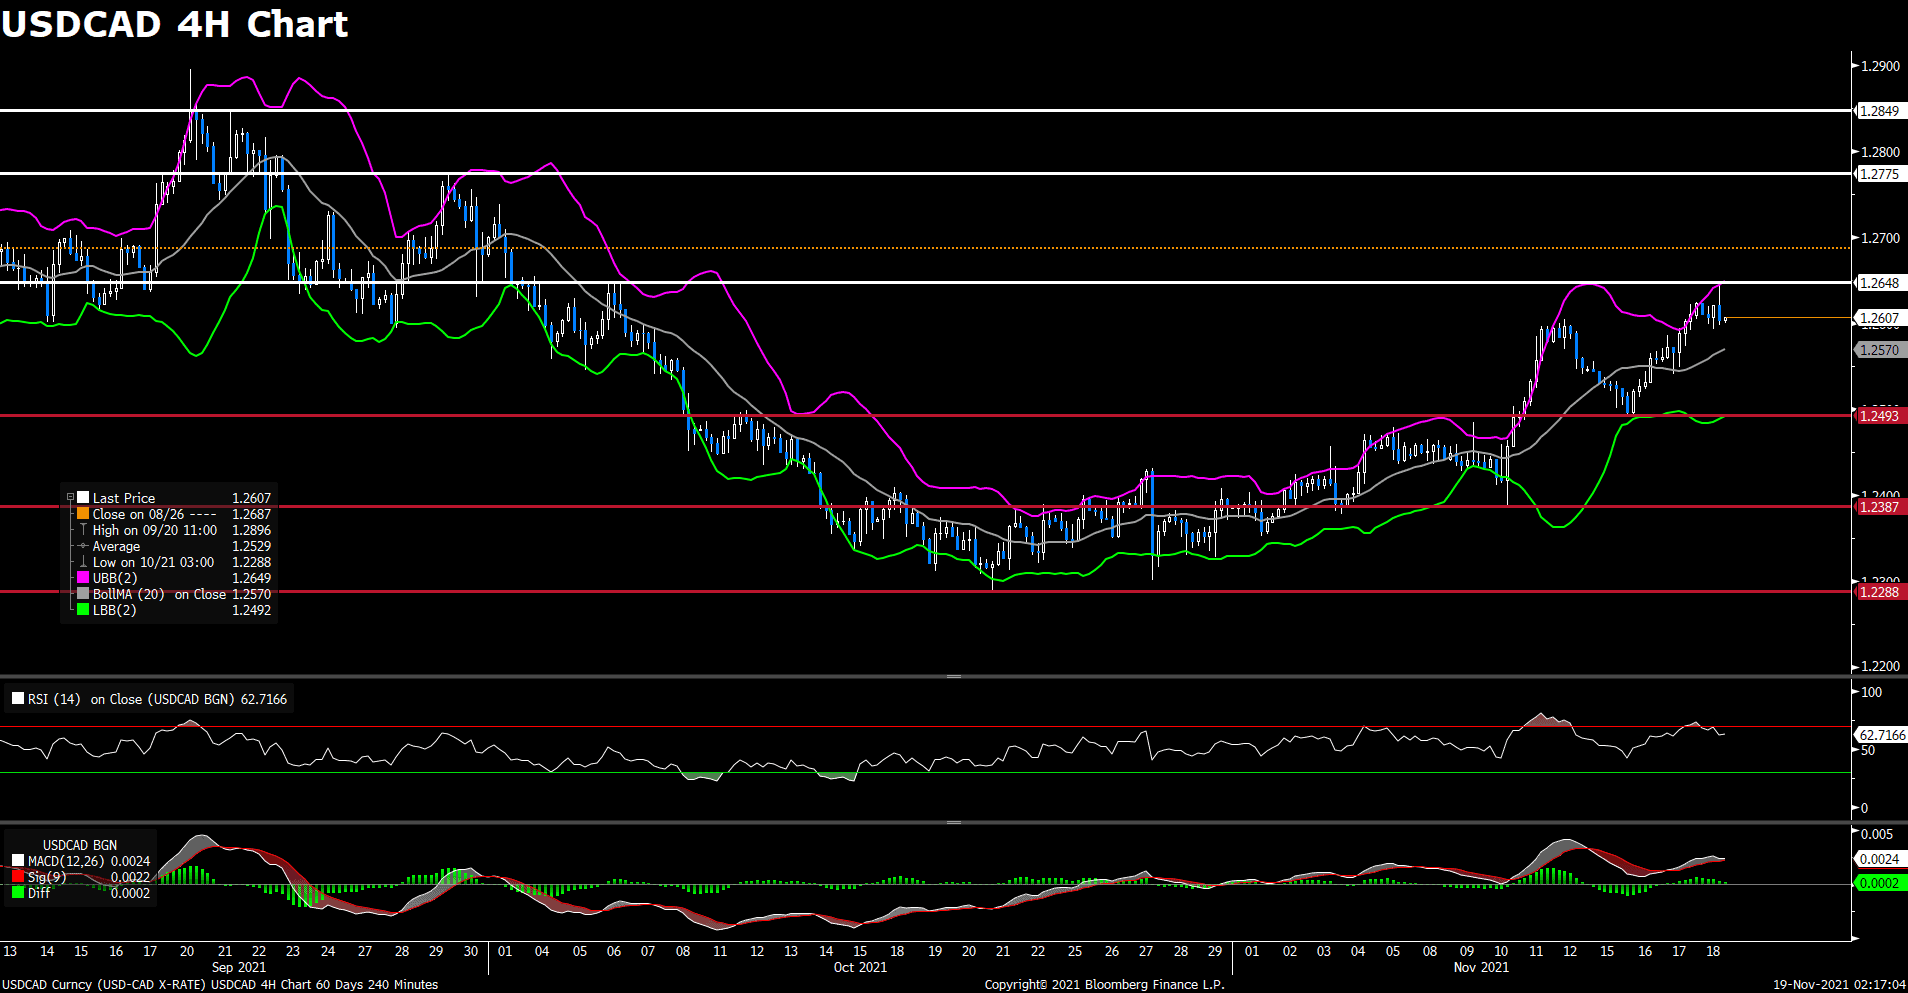
After reaching a fresh monthly top above 1.264 level earlier on Thursday, the pair USD/CAD pulled back to 1.262 area amid renewed US dollar weakness. The pair pared its intraday gains and turned into negative territory, currently losing 0.04% on a daily basis. The upbeat US job data failed to boost the greenback today, as the DXY index dropped further to 95.55 area. Rising crude oil prices provided some bullish momentum for the commodity-linked loonie and dragged the USD/CAD pair lower. Market focus now shifts to Canada’s Retail Sales reports released on Friday, as investors looking for some trading impetus.
For technical aspect, RSI indicator 61 figures as of writing, suggesting bull movement ahead. But looking at the MACD indicator, a death cross is forming on the histogram and a bearish trend could be expected. As for the Bollinger Bands, the price is falling from the upper band and is likely to touch the moving average. In conclusion, we think market will be bearish as long as the 1.2648 support line holds.
Resistance: 1.2648, 1.2775, 1.2849
Support: 1.2493, 1.2387, 1.2288
Economic Data
|
Currency |
Data |
Time (GMT + 8) |
Forecast |
||||
|
GBP |
Retail Sales (MoM) (Oct) |
15:00 |
0.5% |
||||
|
EUR |
ECB President Lagarde Speaks |
16:30 |
|||||
|
CAD |
Core Retail Sales (MoM) (Sep) |
21:30 |
-1.0% |
||||
-
Global - English

-
United Kingdom - English
-
France - Français

-
Spain - Español

-
Portugal - Português

-
Italy - Italiano

-
Germany - Deutsch

-
Turkey - Türkçe

-
MENA - العربية

-
MENA - English
-
Asia - English
-
India - English

-
Indonesia - Indonesia

-
Japan - 日本語

-
South Korea - 한국어

-
Malaysia - Bahasa Malaysia

-
Malaysia - English
-
Philippines - English

-
Vietnam - Tiếng Việt

-
Thailand - ไทย

-
China - 简体中文

-
China - 繁體中文

This site uses cookies to provide you with a great user experience.
By using vtmarkets.com, you accept
our cookie policy.
Start trading with
VT Markets today


![]()
Follow us on:


![]()


