Market Focus
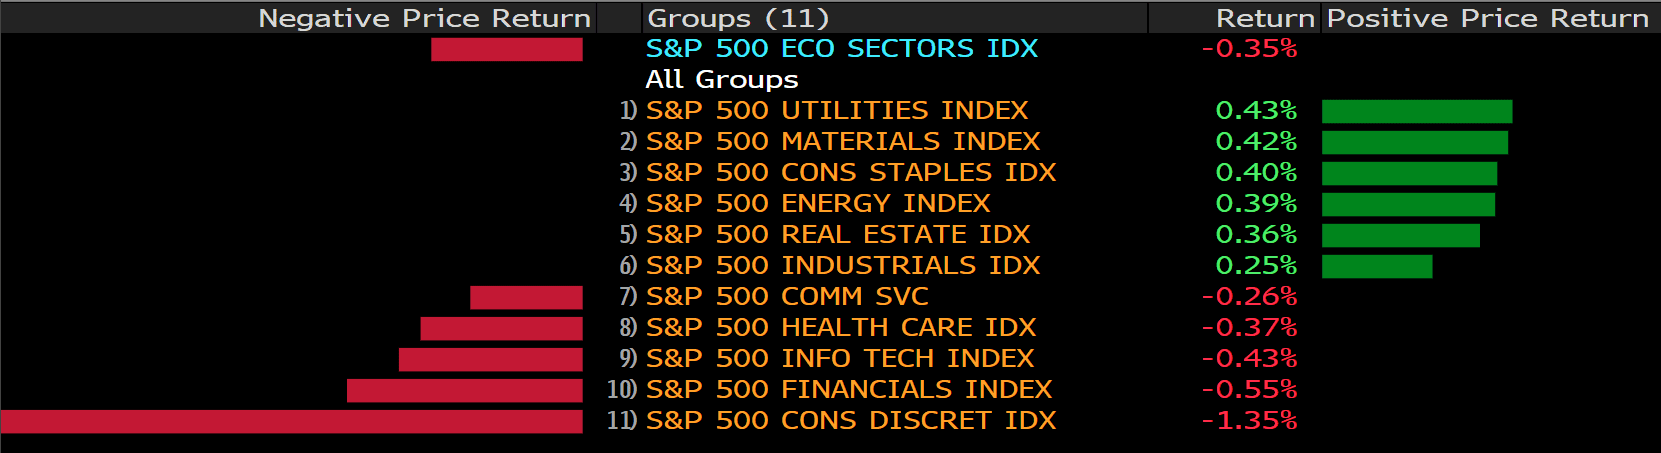
U.S. stocks halted the longest rally since 2017, sending major indices lower from all-time highs as Treasuries surged. The S&P 500 fell for the first time in nine sessions, led by a drop in financial shares that came under pressure as the 10-year yield slumped to the lowest level in seven weeks. Nasdaq tumbled 0.6%, with Tesla Inc. sinking as much as 13% after a tweet by investor Michael Burry. PayPal Holdings Inc. fell after its guidance disappointed. And General Electric Co. rose after saying it will split into three companies.
Every day in the early afternoon, money-market traders are glued to the Fed of New York’s website to see the results of the overnight reverse-repurchase agreement facility.
They’re not the only one. A screenshot of this obscure but important facility’s daily usage is religiously uploaded to a Reddit forum called Superstonk, a discussion board similar to WallStreetBets where users swap memes and stock tips. As usage of the facility swelled, the post regularly became one of the site’s most popular of the day, often attracting thousands of comments.
While professional traders check the central bank’s website to see how much excess liquidity the Fed is sopping up, many Reddit users are interested in, well, something else: Signs of an impending market crash. Or, in some cases, you guessed it: more evidence for why stocks like GameStop Corp. are headed “to the moon.”
If this all sounds a little weird, that’s because it is. There is no way for the type of individual traders who frequent Reddit boards to use the facility, yet the posts appear to be influencing their trading. And the behavior is worth scrutinizing because it’s the type of hive-mind theorizing that has a habit of beginning as a social-media curiosity and ending up having big effects in the real world, such as the wild price action in meme stocks earlier this year.
Main Pairs Movement:
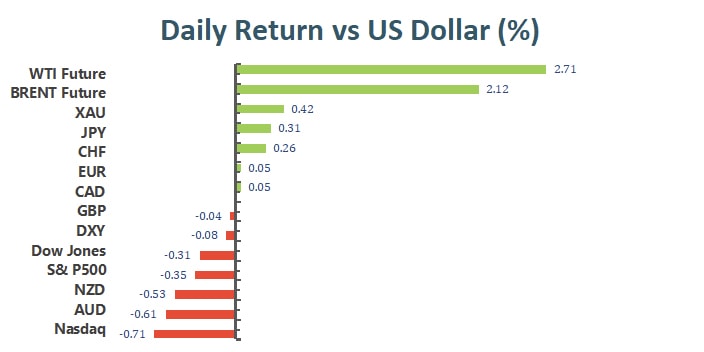
The greenback maintained its tepid tone during the Asian session but became more attractive during US trading hours. The catalyst for the dollar’s demand was another sign of inflationary pressures spurring risk-off. Wall Street edged lower after the release of the US Producer Price Index, confirmed at 8.6% YoY in October.
The EUR/USD pair tried to breach 1.1600 a couple of times but was stopped by robust selling pressure. European Central Bank (ECB) policymakers’ comments were mixed toward the union’s future monetary policy. Klaas Knot said that conditions for a rate hike are very unlikely to be met in 2022, while Supervisory Board Chair Andrea Enria said low ECB interest rates are now hurting bank margins more than they are boosting lending volumes.
Dollar’s performance was mixed against its other major rivals. Cable hovers around 1.3550 after a failed attempt to recover above 1.3600. Ninga dived below the 113.00 threshold, while commodity-linked currencies seemed to lose their upward momentum, as the US EIA raising this year forecast for oil demand by 60,000 barrels per day.
Gold trades at fresh one-month highs around $1,830 a troy ounce amid dismal market sentiments. Crude oil prices soared as well, with WTI posting $84.50, and Brent last seen at $85.10. US Treasury yields declined further on Tuesday, with 10-year benchmark closed at 1.44%.
Technical Analysis:
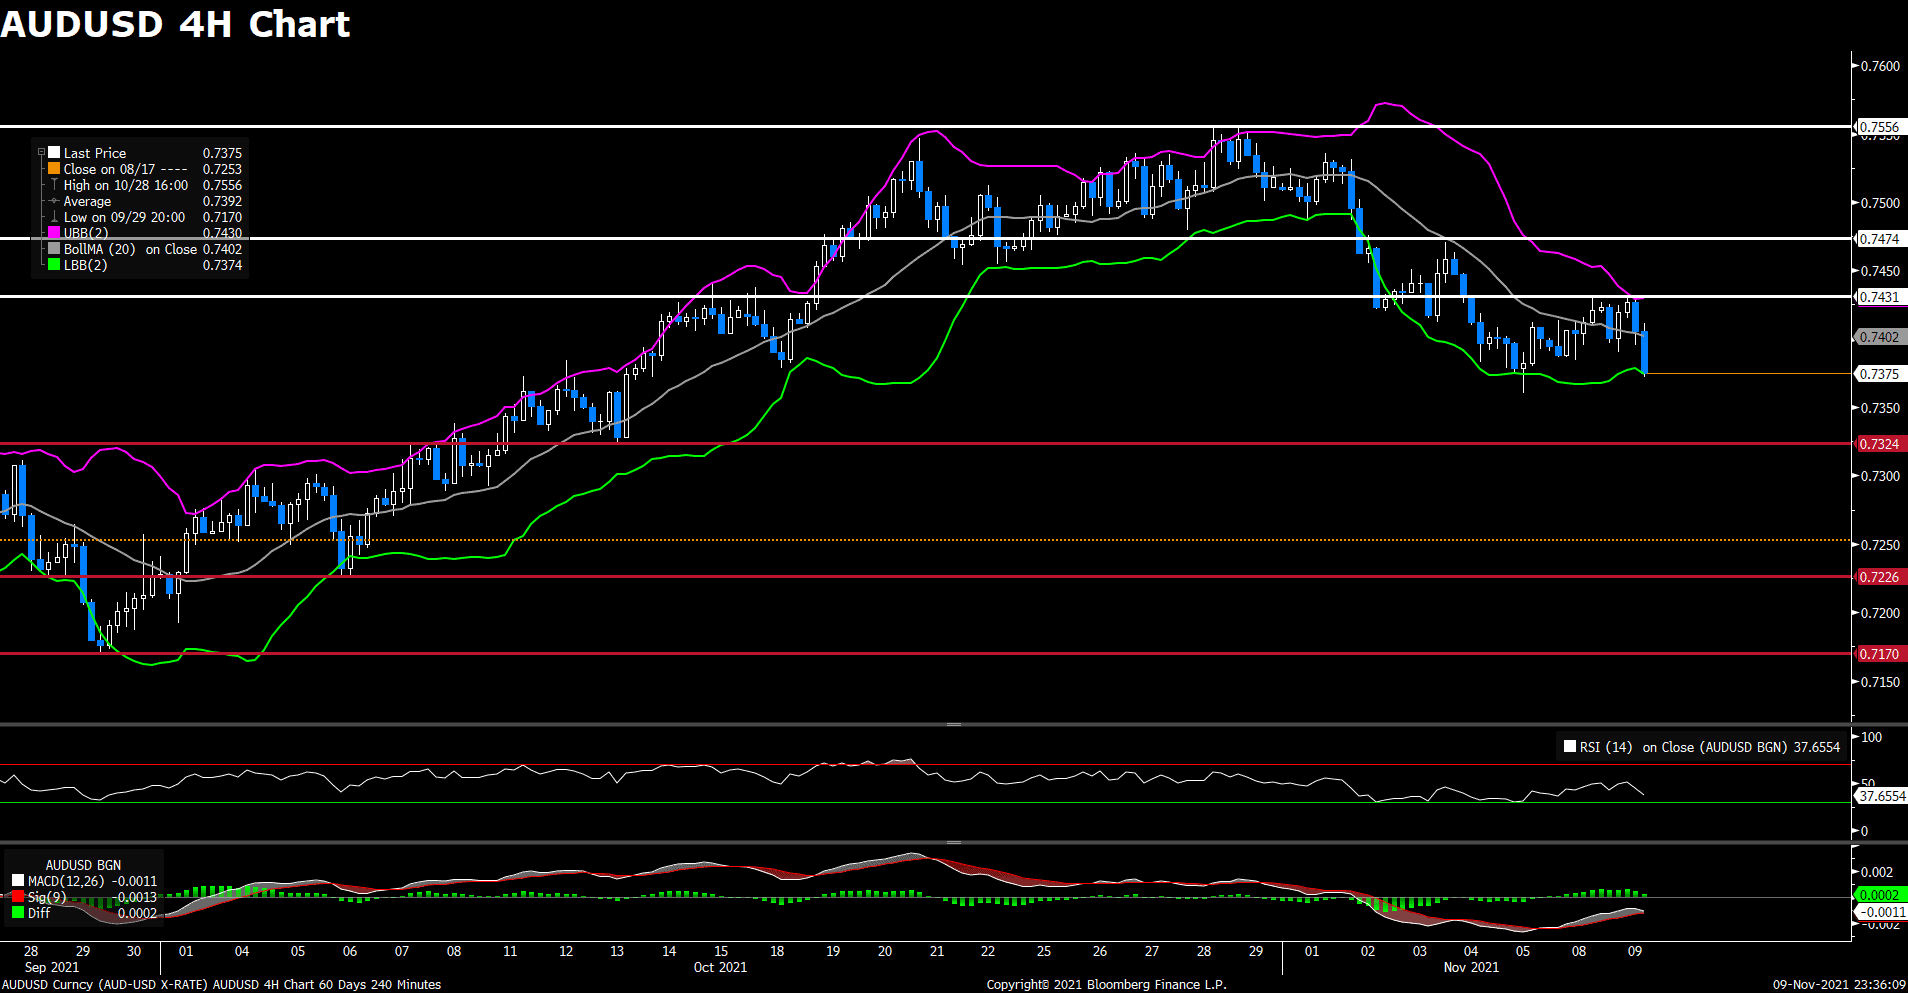
The pair AUD/USD declined on Tuesday, struggling to preserve its previous day rally. The pair was trading lower in early Asian session and touched a daily low under 0.74 level for a time. Even though AUD/USD tried to rebound back during European session, it started to see heavy selling at the time of writing. The National Australia Bank Business Confidence report showed 21 on Tuesday, as the easing of lockdown restrictions resulted in improvement in business confidence. But the upbeat data failed to underpinned AUD/USD, which currently drops towards 0.735 area.
For technical aspect, RSI indicator 38 figures as of writing, suggesting bear movement ahead. For the MACD indicator, the positive histogram starts to diminish which also indicates a possible downward trend for the pair. If we take a look at the Bollinger Bands, the price crossed above the moving average after touching the higher band, therefore the lower band becomes the loss target. In conclusion, we think market will be bearish as long as the 0.7431 resistance line holds.
Resistance: 0.7431, 0.7474, 0.7556
Support: 0.7324, 0.7226, 0.7170
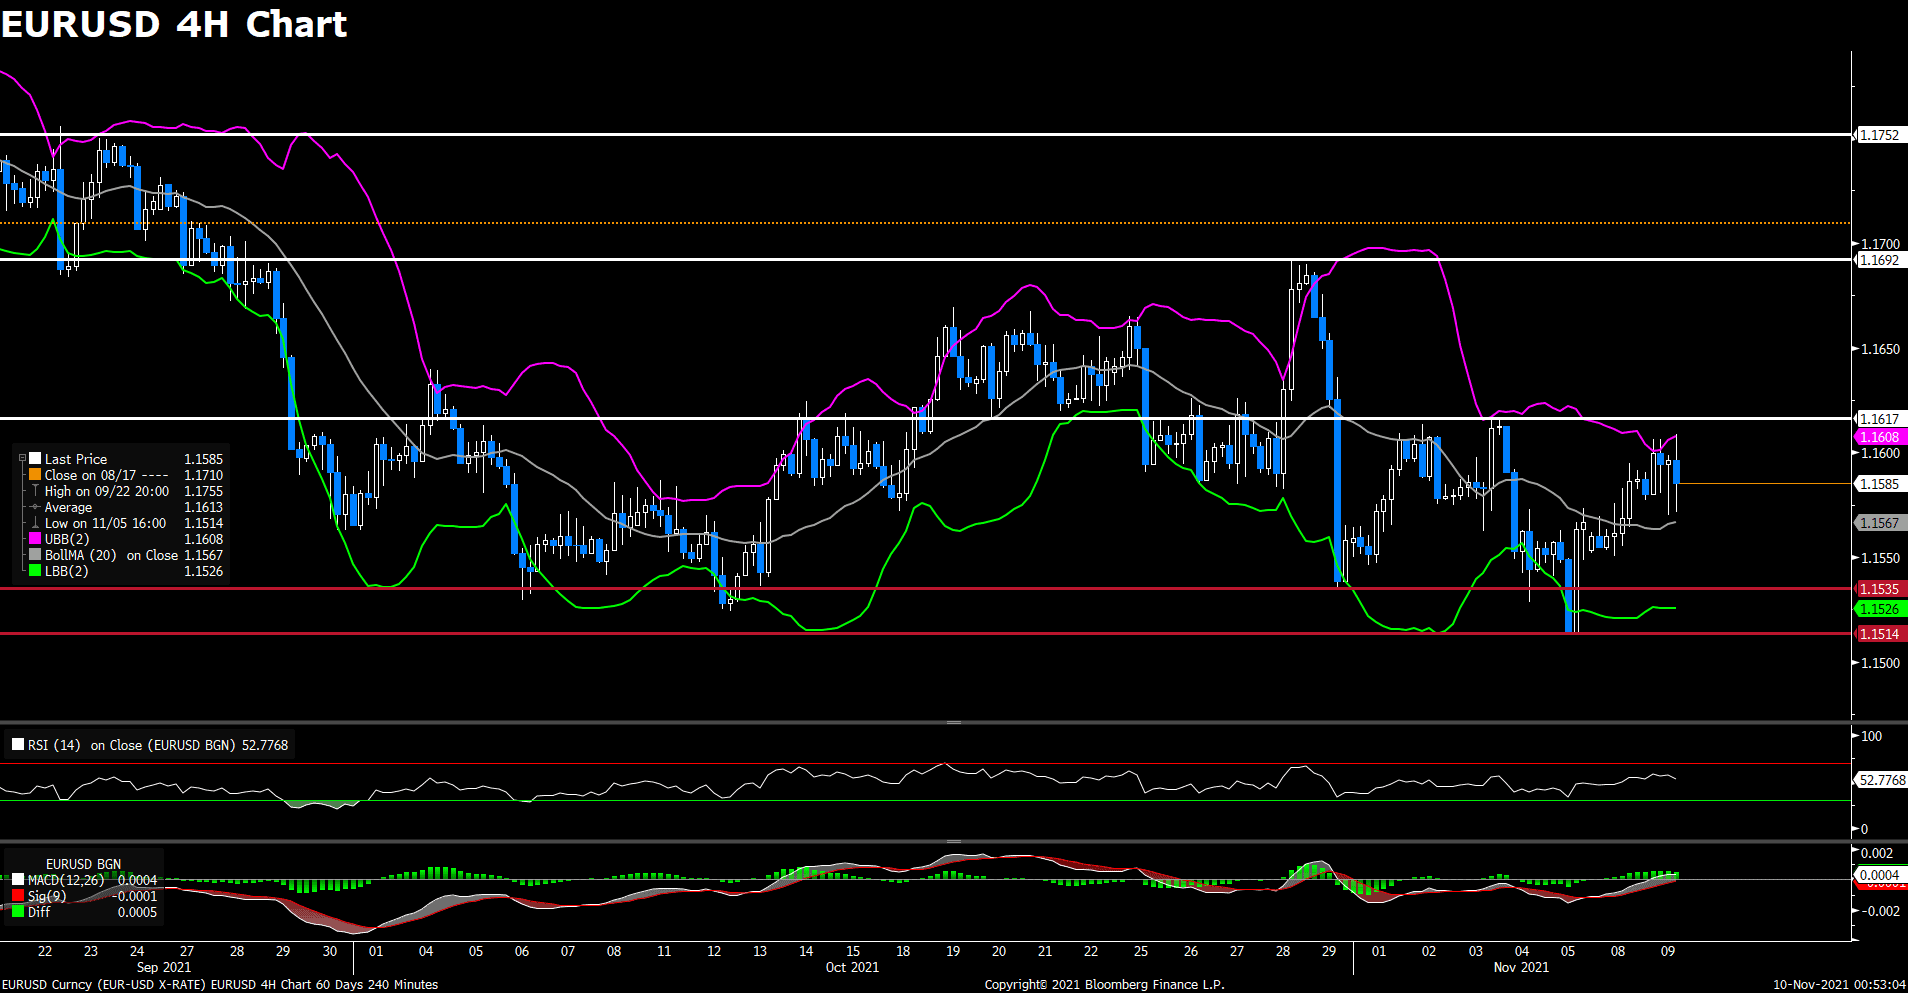
The pair EUR/USD edged higher on Tuesday, currently moving sideways around 1.159 area. The pair touched a three-day high in late Asian session but failed to preserve its bullish momentum as bears took over in European trading hours. EUR/USD was last seen trading at 1.1588, posting a 0.03% gain for the day. The renewed weakness witnessed in US dollar provided some supports for the pair. However, expectations that the Fed would adopt a more aggressive policy response to high inflation could limit the loss for the greenback and cap the upside for EUR/USD. Some FOMC officials also signaled that the Fed could raise rates by the end of 2022.
For technical aspect, RSI indicator 50 figures as of writing, suggesting that there is no obvious trend now. As for the MACD indicator, The MACD is now sitting above the signal line, which indicates a possible upward trend for the pair. Looking at the Bollinger Bands, the price fall towards the moving average after touch the upper band, which also indicate a downward trend continuation. In conclusion, we think market is consolidating now without clear direction. Market focus shifts to US CPI report on Wednesday and investors could look for trading impetus.
Resistance: 1.1617, 1.1692, 1.1752
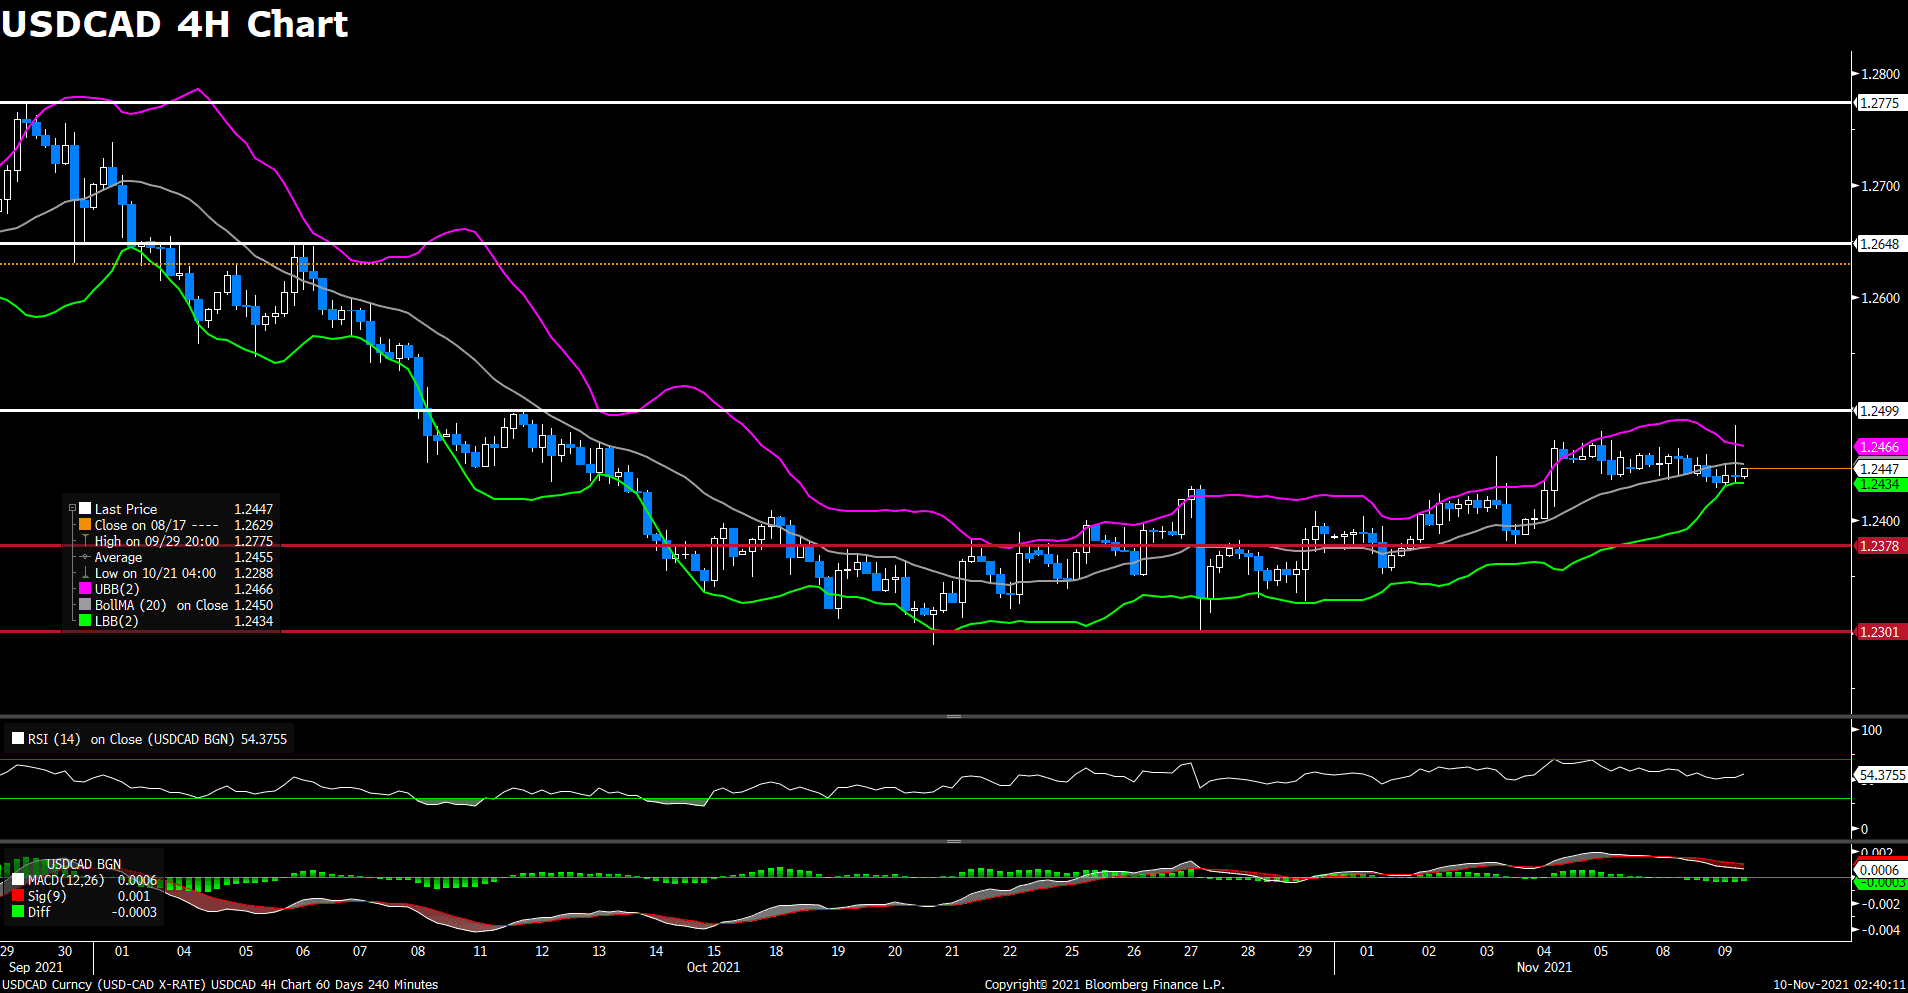
The pair USD/CAD now rising 0.02% on Tuesday despite weaker US dollar across the board. USD/CAD pair starting to see heavy selling after it touched a fresh daily top. Falling US Treasury bond yields weighed on the greenback, as the 10-year yield loses 4.15% for the day. On top of that, higher crude oil prices underpinned the Loonie as the rising jet fuel demand helped global oil demand recover back to pre-pandemic levels above 100M barrels per day. Investors now await tomorrow’s US CPI data, which is a key way to measure changes in purchasing trends and inflation.
For technical aspect, RSI indicator 53 figures as of writing, suggesting tepid bull movement ahead. As for the Bollinger Bands, the price is rising from the lower band and chances are high that it will move towards the upper band since prices have a tendency to bounce within the bands’ envelope. In conclusion, we think market will be bullish as the pair may try to re-test the 1.2499 resistance.
Resistance: 1.2499, 1.2648, 1.2775
Support: 1.2378, 1.2301
Economic Data
|
Currency |
Data |
Time (GMT + 8) |
Forecast |
||||
|
USD |
Core CPI (MoM) (Oct) |
21:30 |
0.4% |
||||
|
USD |
Initial Jobless Claims |
21:30 |
265K |
||||
|
USD |
Crude Oil Inventories |
21:30 |
2.125M |
||||