


Daily market analysis
October 22, 2021
Market Focus
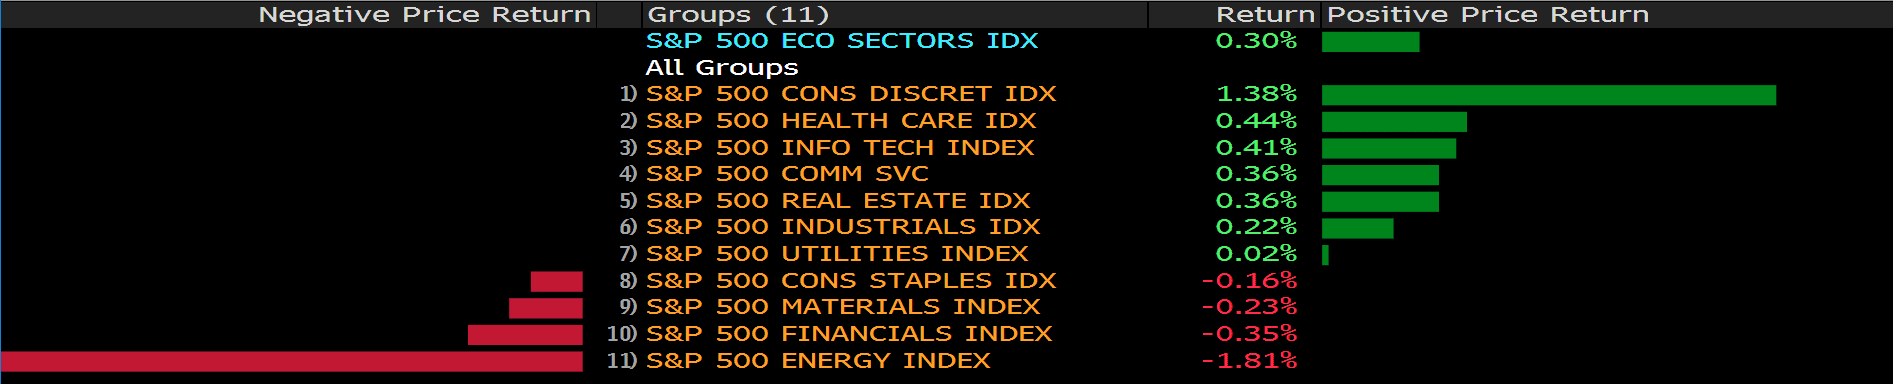
US markets were mixed amid strong earning reports from companies and upcoming Fed’s tapering move. The S&P 500 continued to notch a new record, and the tech- heavy weighted Nasdaq Composite rose 0.6% on Thursday. The Dow Jones Industrial Averages closed a bit lower after reaching a all- time high on Wednesday, dropping 6 points.
Bloomberg
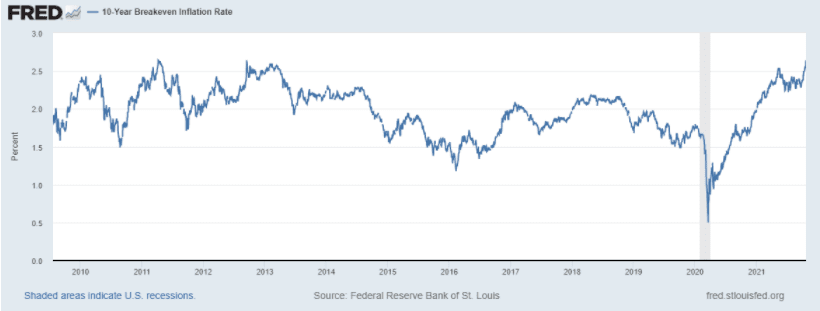
US Treasury yields rise as markets await on Fed’s next move on the timing of lifting interest rates after it finished tapering. US inflation expectation, which is measured by the 10- year breakeven inflation jumps to the highest since 2012. The US dollar might witness a rally when the 10- year yield crosses 1.70% mark.
Fred
Responding to a growing controversy over investing practices, the Fed has announced new rules to ban policymakers from investing individual stocks. In the meantime, they will be restricted to buy and sell mutual funds, needing permissions to buy and sell. The purpose of the change is to rephrase Fed’s ethical conduct and wipe out the controversy.
Main Pairs Movement:
The US dollar trades at the familiar levels throughout the day as the light macro calendar provides no news to impact the market. The dollar index consolidated within a tight range between 93.550 to 93.800. Further instructions may be given after the Markit PMIs revealed on Friday.
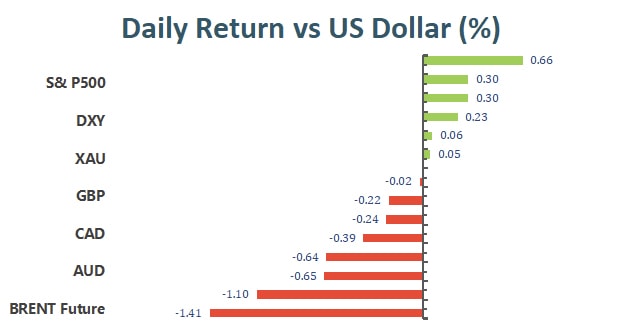
However, most major pair performs badly against the greenback. The EUR/USD pair trades around 1.1625, while GBP/USD dropped below the 1.3800 level, hovering around 1.3785. The commodity-linked currencies failed to maintain their previous momentum, with AUD/USD dropped over 0.5% to 0.7465, NZD/USD retreated to 0.7150, and USD/CAD surged over 70 pips to 1.2375. JPY is the best performer of the day. USD/JPY once dived to 113.65, and settled at 114.00 at the time of writing.
Gold seesawed around $1,780 a troy ounce during the day, while crude oil encountered some corrective selling pressures, with WTI slip to $82.60 a barrel, and Brent at $84.70. The US benchmark 10-year Treasury yield resumed its 5-day winning streak and reached a 5-month high at 1.690%.
Digital assets plunged on Thursday right after Bitcoin hit an all time high yesterday. Bitcoin has lost over 7% of its total value from its peak, while Ethereum declined a modest 1.90%, still standing above the $4,000 threshold.
Technical Analysis:
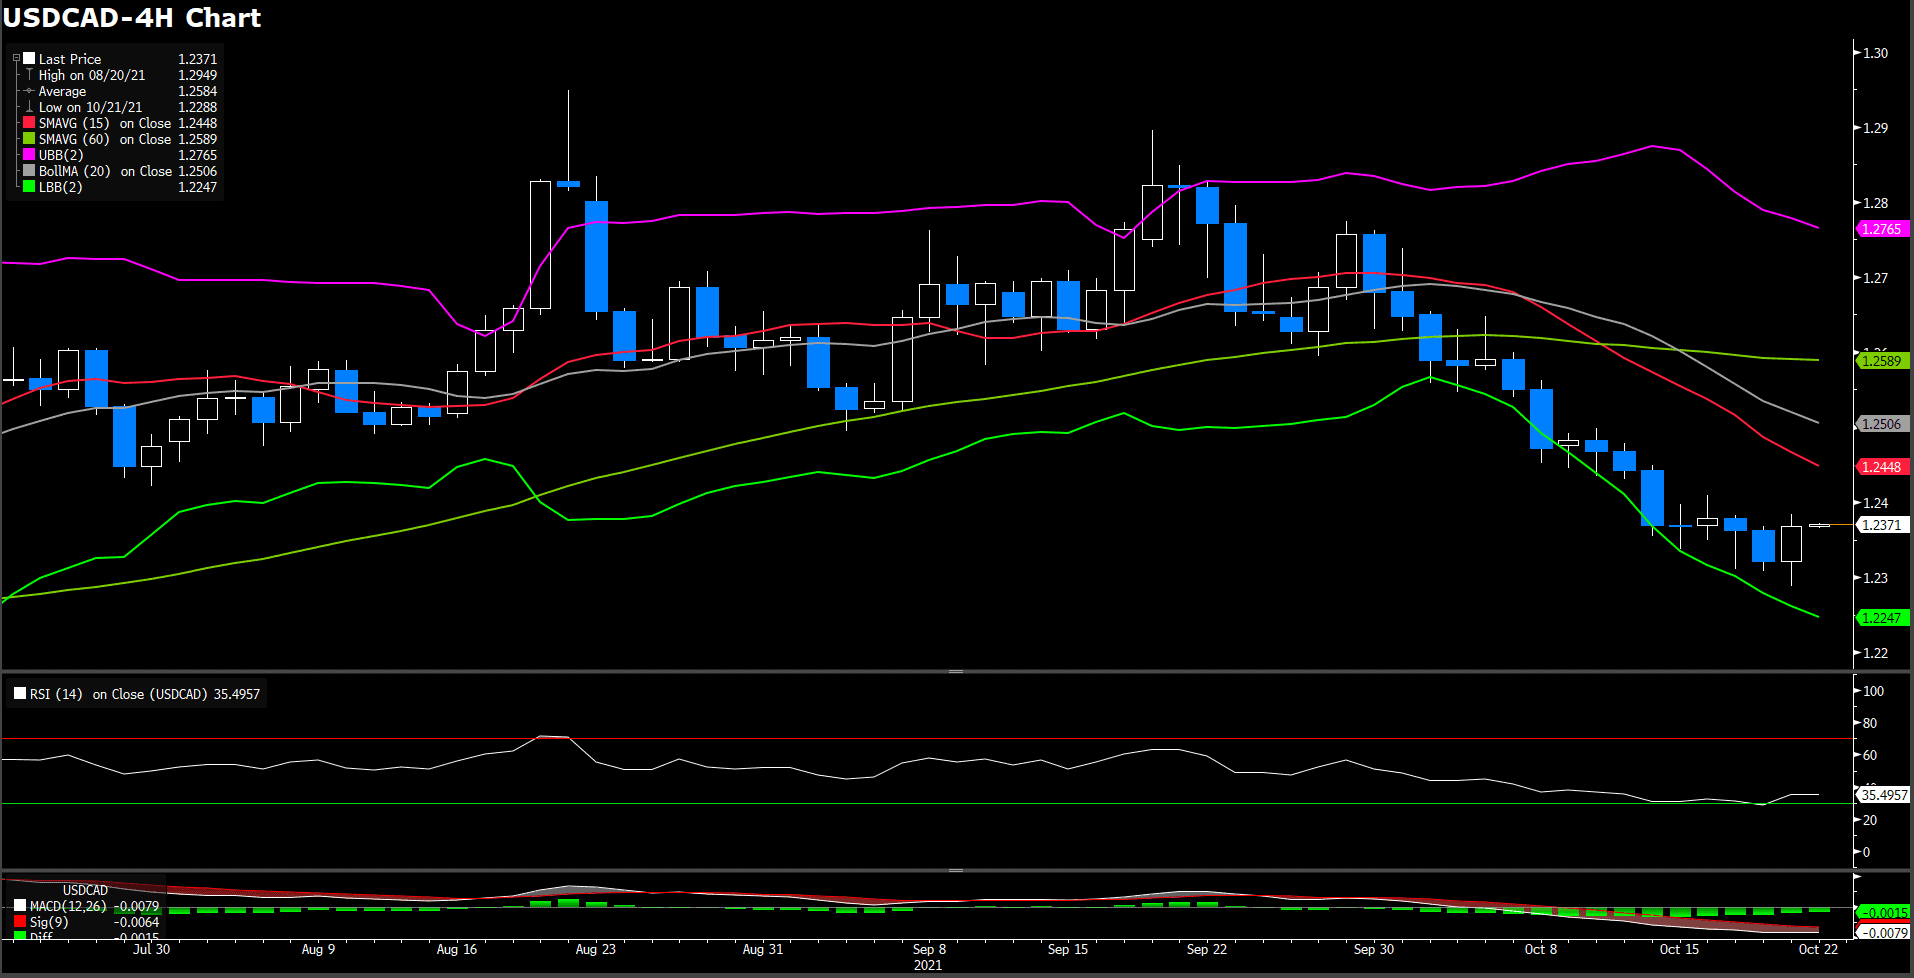
Loonie has finally got a decent hike on Thursday after losing for almost 3 weeks. The pair posted a lowest daily close since early July at 1.2288 on Asian hours, and then bounced to the upside. During the American session, it printed a fresh daily high at 1.2383 and was last seen at 1.2370.
The dollar index swung higher at the close of the Wall Street, ending its six-day downtrend. Higher US Treasury yields and deteriorating market mood underpinned the greenback. Moreover, the correction moves in oil prices also weighed on the CAD demand, further pushing the USD/CAD price level upward. The main trend in USD/CAD should still be downside, as long as the worldwide recovery from the pandemic continues, and the demand for energy remains robust.
On the technical front, both the daily MACD histogram and the RSI indicator suggested a strong bearish sentiment. The price actions have been away from the bottom of the Bollinger band, sparing some rooms for further southern extension.
Resistance: 1.2480 (50% Fibonacci), 1.2750 (78.6% Fibonacci), 1.29490 (yearly high)
Support: 1.2232 (23.6% Fibonacci), 1.2010 (yearly low)
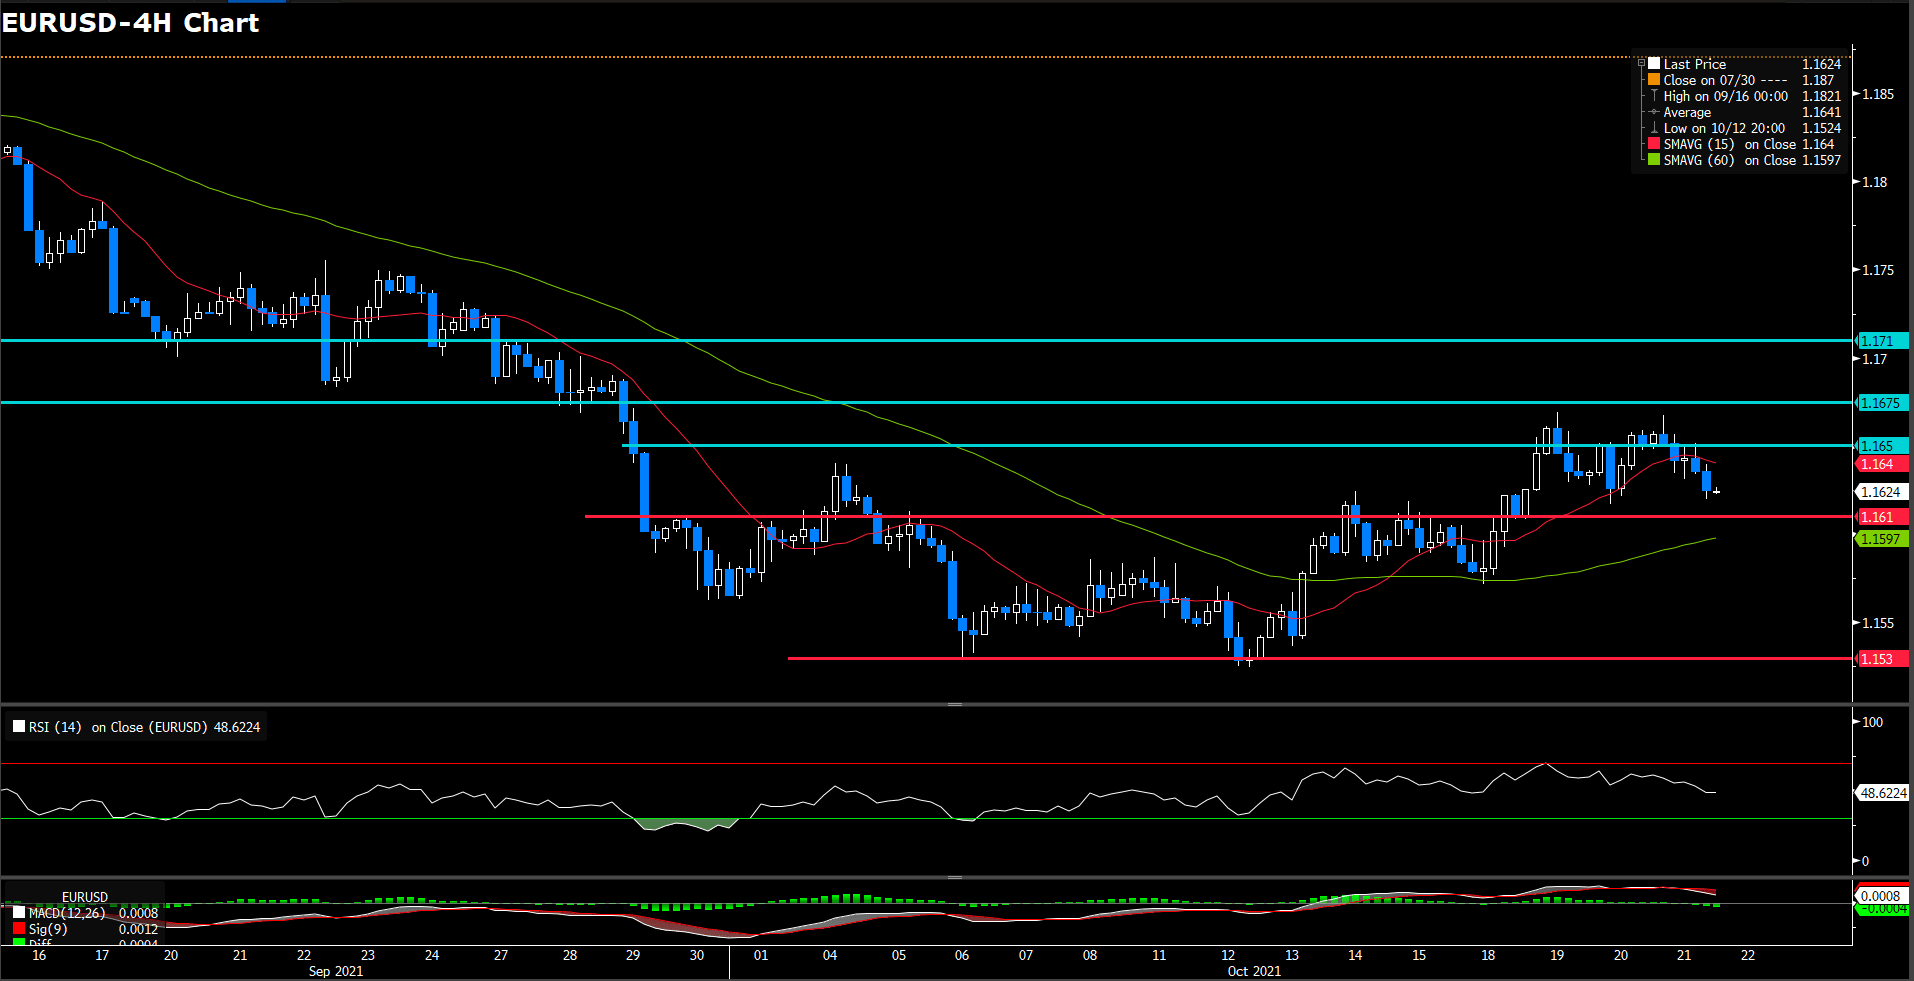
The euro has consecutive its reversal from week-highs at 1.1665 to hit fresh session lows at 1.16 during Thursday’s late U.S. session. The pair is giving away gains. After a three-day rally, weighed by higher demand for greenback amid a sourer market sentiment. Quarterly earning has failed to lift spirits and concerns about the surging inflation and supply chain collapse have turned to the hotline, bolster demand for safe assets against riskier currencies as euro fiber. On macroeconomic side, U.S. data gas been mixed. Weekly jobless claims have dropped to their lowest levels in 19 months and existing home sales increased 7.0%, the highest reading since January. On the other hands, the Philadelphia Fed Manufacturing survey dropped to 23.8 from 30.7 in the previous month. On technical side, the RSI moved down under 50 threshold to 48.6 figures in day market, suggesting a slightly bearish movement in short term. On moving average aspect, 15- long indicator has reversed it way to downward with exceedingly rapid momentum and 60-long indicator is turning it head to slightly upward momentum.
In lights of the backdrop to mixed suggestion from indicators, we deem euro fiber will continue afloat in a consolidation range between 1.161 and 1.1675. Moreover, it should hovered perfectly upside momentum as it breakthrough a W patter by price action suggestion. However, market still linger in a choppy box pattern.
Resistance: 1165, 1.1675, 1.171
USDJPY (4 Hour Chart)
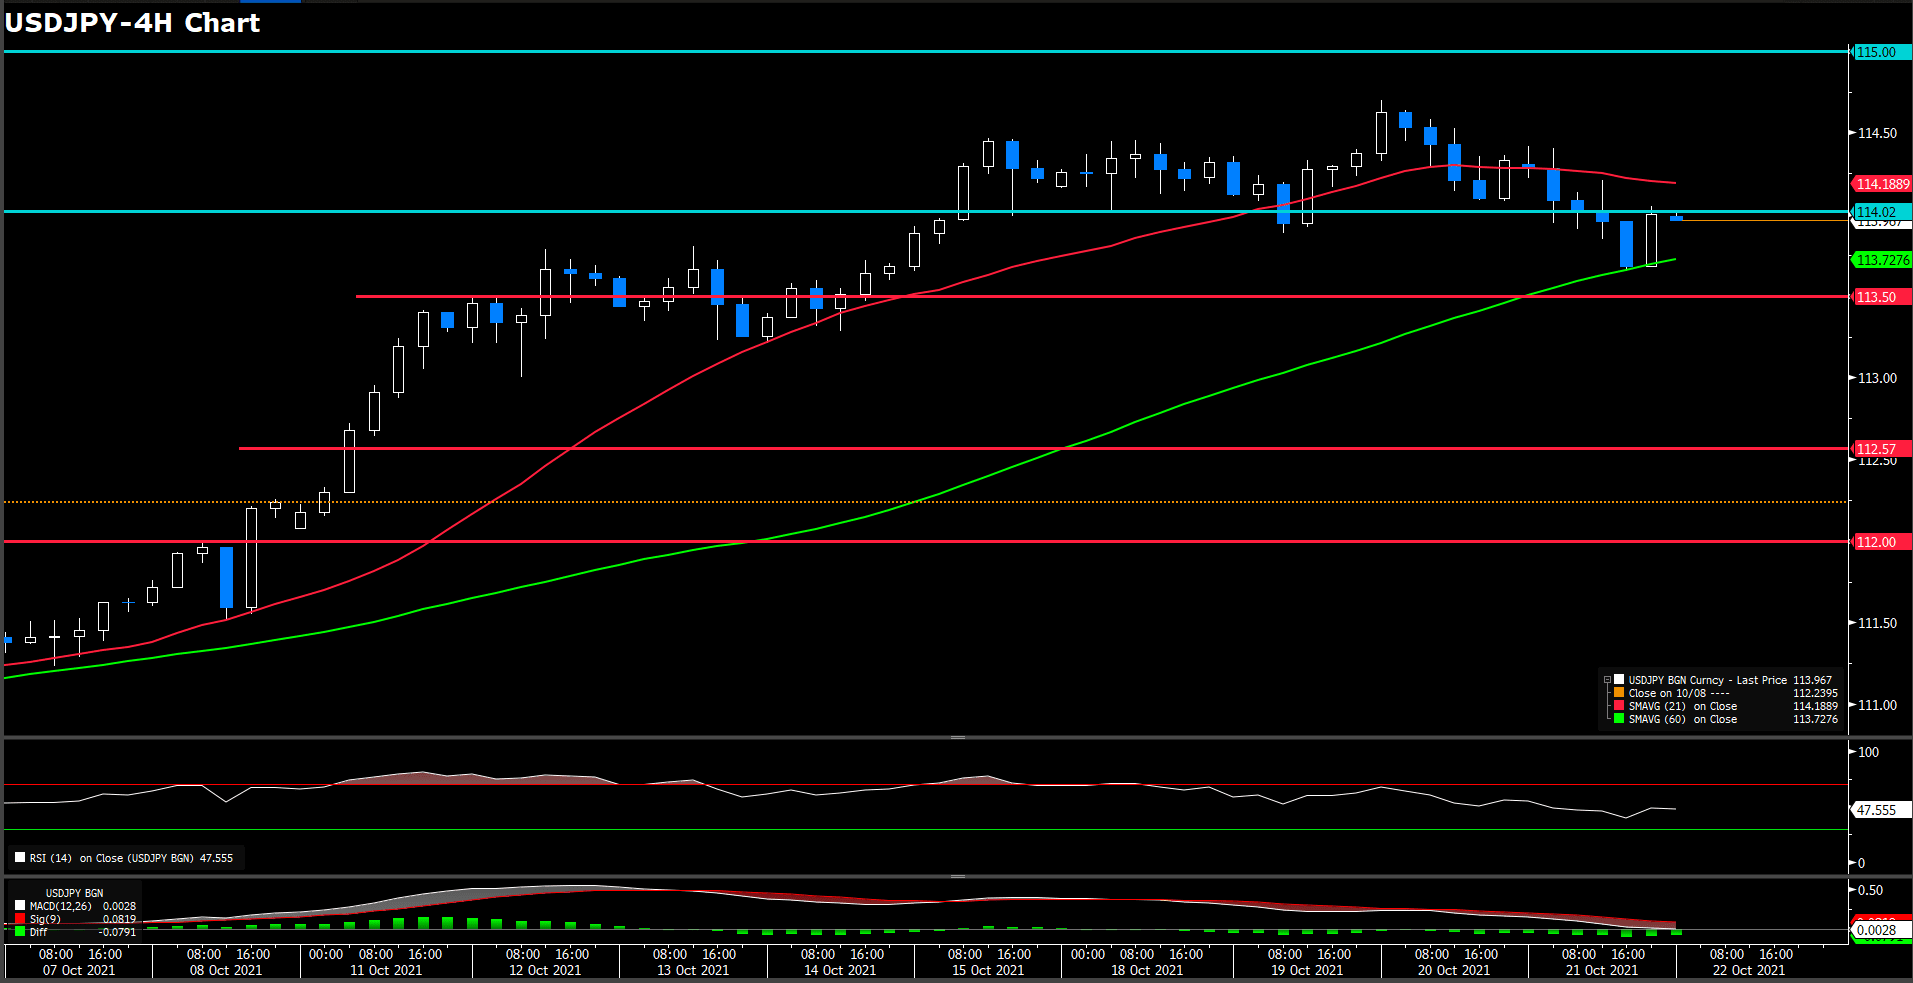
Japan yen edged lower for the second successive day after hitting the highest level in years amid reviving safe-haven demand. Renewed worries about China’s property sector extended support to the safe-haven JPY. Recently, it dropped below 114 level to 113.63, the lowest point in the week. Furthermore, U.S. 10-year Treasuries bond yield hitting 4-month peak at 1.68%. The market is anticipating that the persistently high inflation and global supply chain congestion will force the Fed to accelerate its tapering of their monetary policy, which has provided additional support to the dollar as well.
From a technical perspective, RSI indicator retreat under natural level at 48, suggesting slightly bearish momentum in short term. On moving average indicator, 15-long indicator has turned it way to subtle downside and 60-long indicator retaining upward movement.
Since yen sipped under 114 level as a neckline of double head, it seems lost bullish momentum under currently circumstance according price action. Therefore, we deem strong resistance has turn to 114 and 115 next. On slip way, we expect next immediately support will be psychological level at 113.5
Economic Data
|
Currency |
Data |
Time (GMT + 8) |
Forecast |
||||
|
GBP |
Retail Sales (MoM)(Sep) |
14:00 |
0.5% |
||||
|
EUR |
German Manufacturing PMI (Oct) |
15:30 |
56.5 |
||||
|
GBP |
Composite PMI (Oct) |
16:30 |
– |
||||
|
GBP |
Manufacturing PMI (Oct) |
16:30 |
– |
||||
|
GBP |
Service PMI |
16:30 |
– |
||||
|
EUR |
EU Leader Summit |
18:00 |
– |
||||
|
CAD |
Core Retail Sales (MoM)(Aug) |
20:30 |
2.8% |
||||
|
USD |
Fed Chairman Powell Speaks |
23:00 |
– |
||||
-
Global - English

-
United Kingdom - English
-
France - Français

-
Spain - Español

-
Portugal - Português

-
Italy - Italiano

-
Germany - Deutsch

-
Turkey - Türkçe

-
MENA - العربية

-
MENA - English
-
Asia - English
-
India - English

-
Indonesia - Indonesia

-
Japan - 日本語

-
South Korea - 한국어

-
Malaysia - Bahasa Malaysia

-
Malaysia - English
-
Philippines - English

-
Vietnam - Tiếng Việt

-
Thailand - ไทย

-
China - 简体中文

-
China - 繁體中文

This site uses cookies to provide you with a great user experience.
By using vtmarkets.com, you accept
our cookie policy.
Start trading with
VT Markets today


![]()
Follow us on:


![]()


