Daily Market Analysis
Market Focus
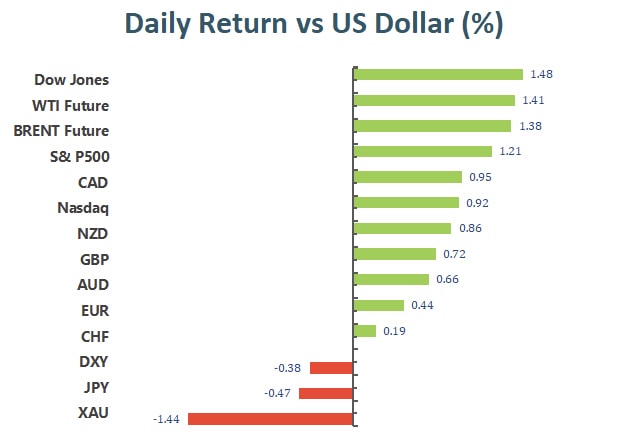
US stock advanced on Thursday amid risk-on market sentiment, as investors embraced the Federal Reserve’s bullish economic outlook. After the two-day FOMC meeting, Fed has turned more hawkish and is expected to reduce bond purchases in November at the earliest. Generally, a hawkish Fed should be bearish for equity market. But surprisingly, the hawkish tone from Fed is welcomed by investors as it was seen as a confirmation of substantial progress in economy recovery. Additionally, gold declined and oil rose.
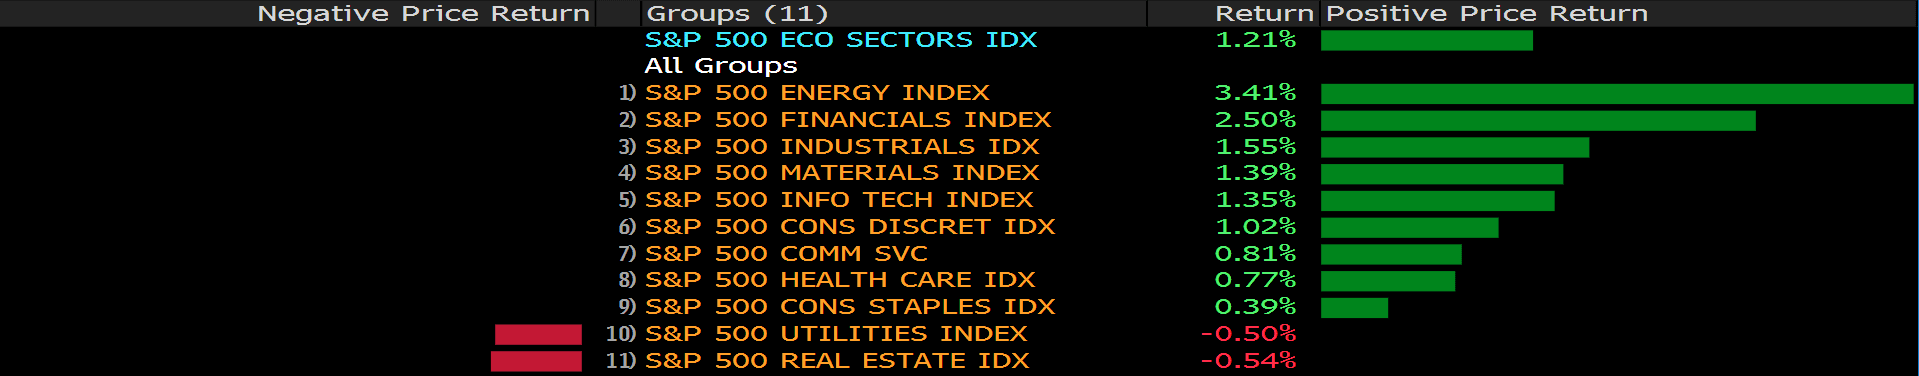
The benchmarks, S&P 500, Dow Jones and Nasdaq both rose on Thursday as they rode the waves of positive risk sentiment. S&P 500 was up 1.2% on a daily basis, the index registered its biggest two-day gain since July. Nine out of eleven sectors posted a gain as the energy and financials sectors are the best performing among all groups, rose 3.41% and 2.50%, respectively. Real estate .and utilities were the only major groups to end lower on the day. The Dow Jones gained the most of 1.5%.
On top of that, the Bank of England moved closer to raising interest rates after officials said developments appear to have strengthened the case for modest tightening. Therefore, the British pound rallied on Thursday.
In Asia, Financial regulators in Beijing instructed China Evergrande Group to avoid a near-term dollar bond default. China also said to have told the company to focus on completing unfinished properties and repaying individual investors. For now, there is no indication that regulators offered financial support to Evergrande Group for the bond payment yet, and concerns of an Evergrande failure continues.
Main Pairs Movement:
The 2-day long Fed meeting concluded with signals from the FOMC that tapering should start relatively soon and a revised rate hike schedule, which could begin by, as early as, 2022. Besides the FOMC minutes, markets were also moved by a report that Chinese authorities signaled reluctance to bail out Evergrande, despite the Chinese Government’s continued effort to inject more cash into the financial system; furthermore, the Chinese regulators have instructed Evergrande to avoid near-term default on bonds. The combination of the two events boosted investor sentiment and a risk-on investing scene, as most U.S. indices continues to rise for the second day in a row.
Cable rose against the dollar, as the Greenback weakened due to investors redirecting funds into a “risk on” equity market environment. The Pound was also fueled by the increasingly hawkish stance of the BoE. The redirecting on funds and “risk on” sentiment hurt gold, as the precious metal tumbled throughout the trading day.
Technical Analysis:
GBPUSD (4-hour Chart)
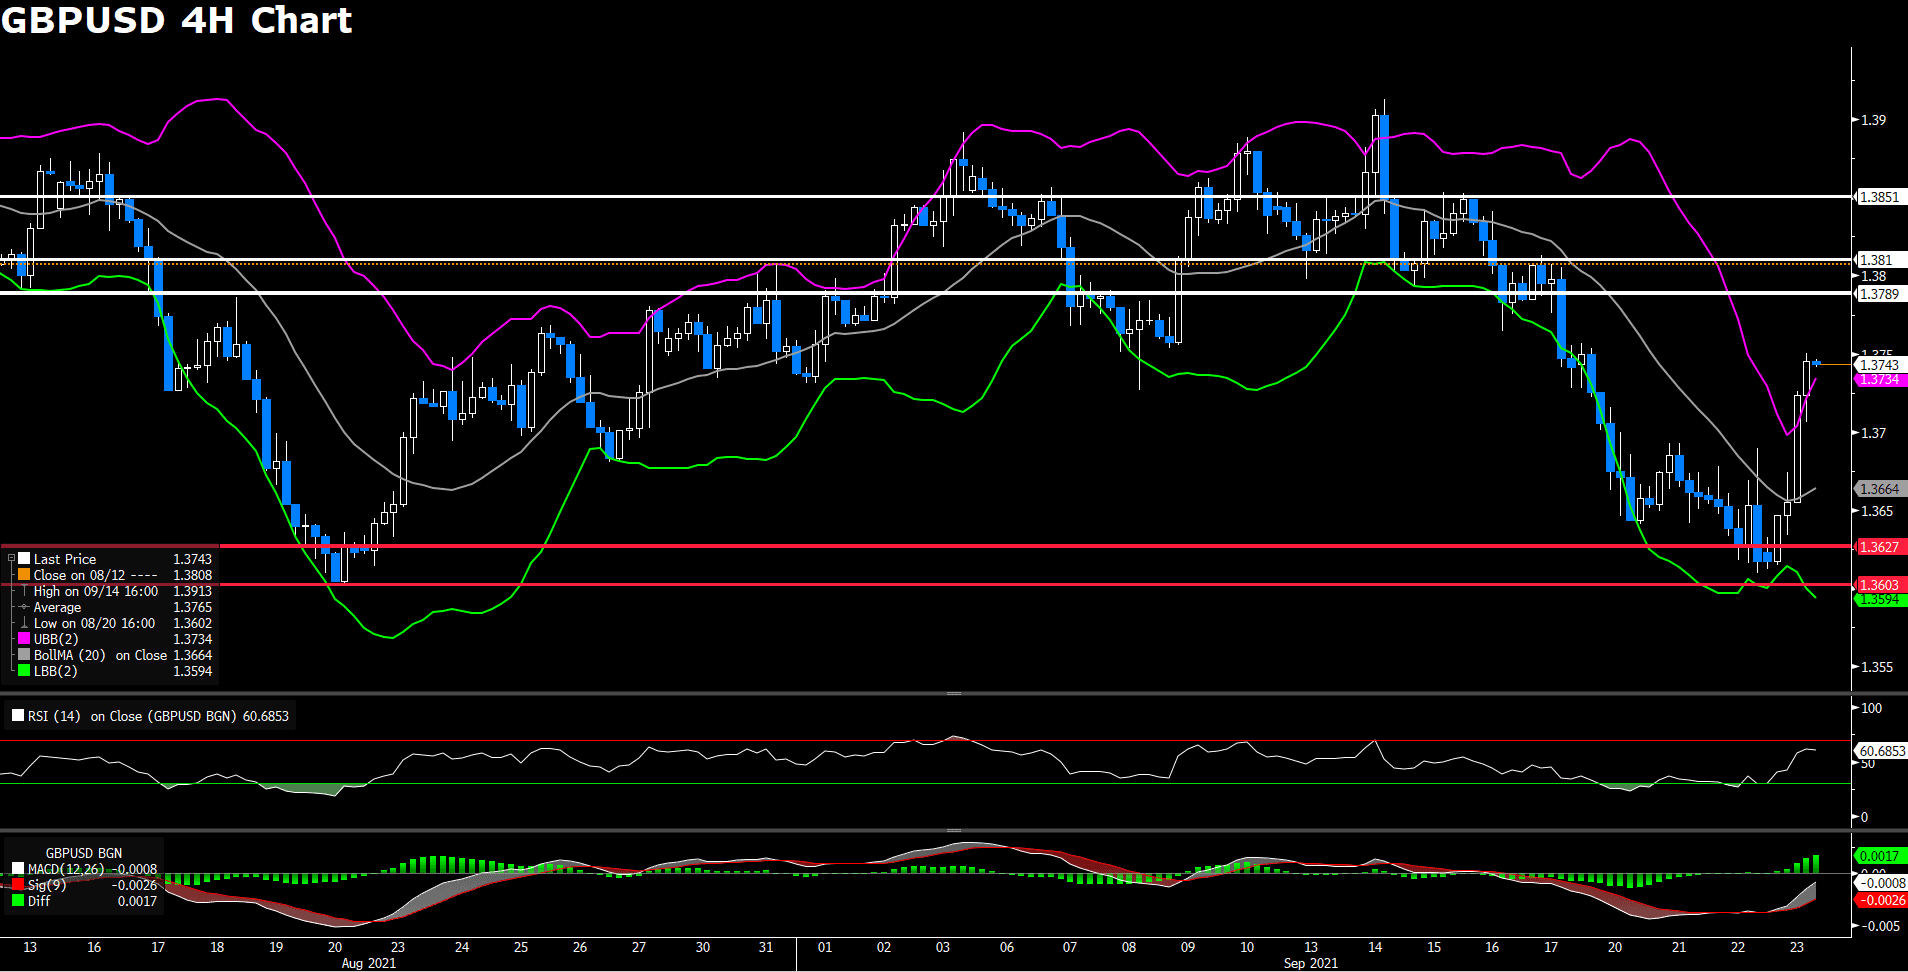
Cable traded lower during the European trading session, but the pair would rebound, significantly, once the Asia and American trading session began. Broad Greenback weakness and risk-on sentiment in equity markets have propelled Cable to its 3 day high. The BoE’s increasingly hawkish tone also added to the Pound’s strength against the Dollar. As of writing, Cable has broken through our previously estimated resistance level of 1.3687 and the pair is trading at 1.3747.
From the technical aspect, Cable successfully defended the 1.36 support level and quickly broke through the 1.3687 resistance level. Near term resistance for Cable will sit at around the 1.378 price level. RSI for the pair sits at 61.5, indicating modest over buying in the market. As of writing, Cable is trading above the 50, 100, and 200 day SMA.
Resistance: 1.3687, 1.381, 1.3851
Support: 1.3627, 1.3603
USDCAD (4- Hour Chart)
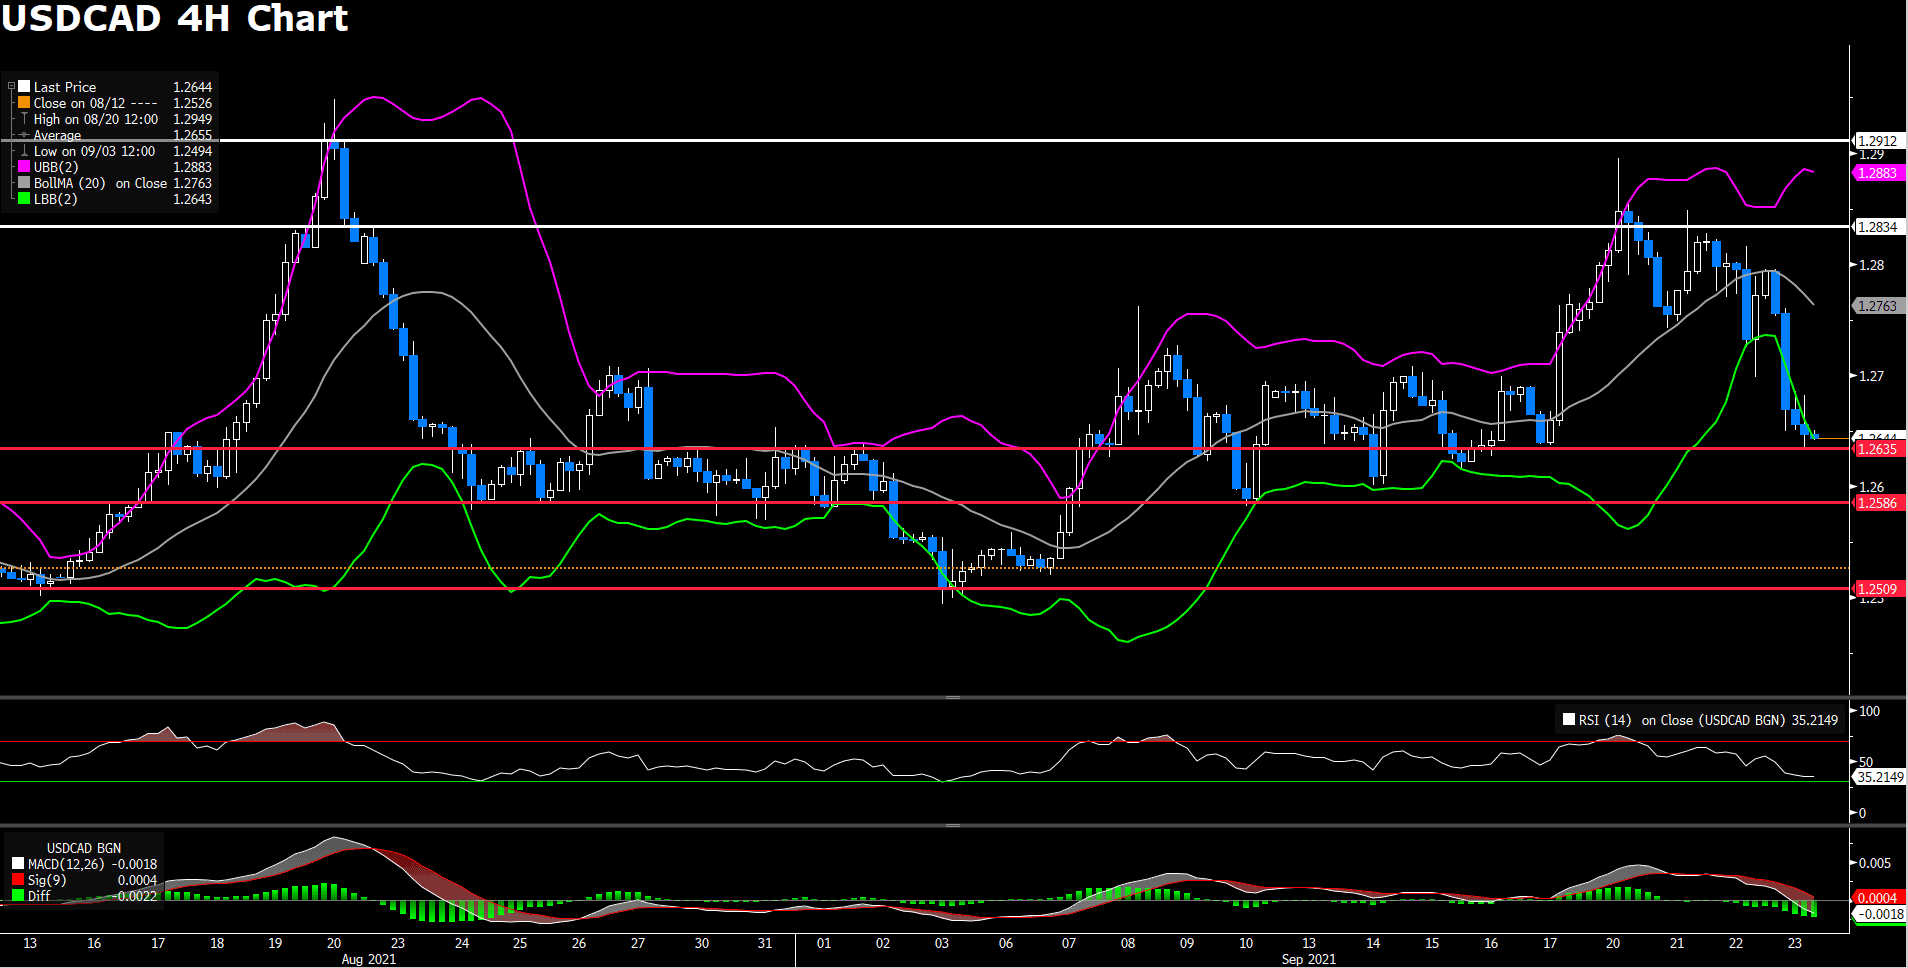
USD/CAD reversed course for the day as the Dollar loses steam, and brought the pair below our previously estimated support level of 1.2752. During the earlier part of the trading session, USD/CAD was able to repair some losses from the previous trading day, but the pair quickly lost ground once the American trading session began. The Canadian July retail sales declined, although actual figures fared better than analyst estimates.
From the technical aspect, USD/CAD broke through the 1.2752 support level and is currently trending towards the nearest support level of 1.2635. RSI for the pair is at 35.47, indicating modest over selling. As of writing, the pair is trading at the lower bound of the bollinger bands, and the pair is trading below its 50, 100, and 200 day SMA.
Resistance: 1.2834, 1.2912
Support: 1.2752, 1.2635, 1.2586
XAUUSD (4- Hour Chart)
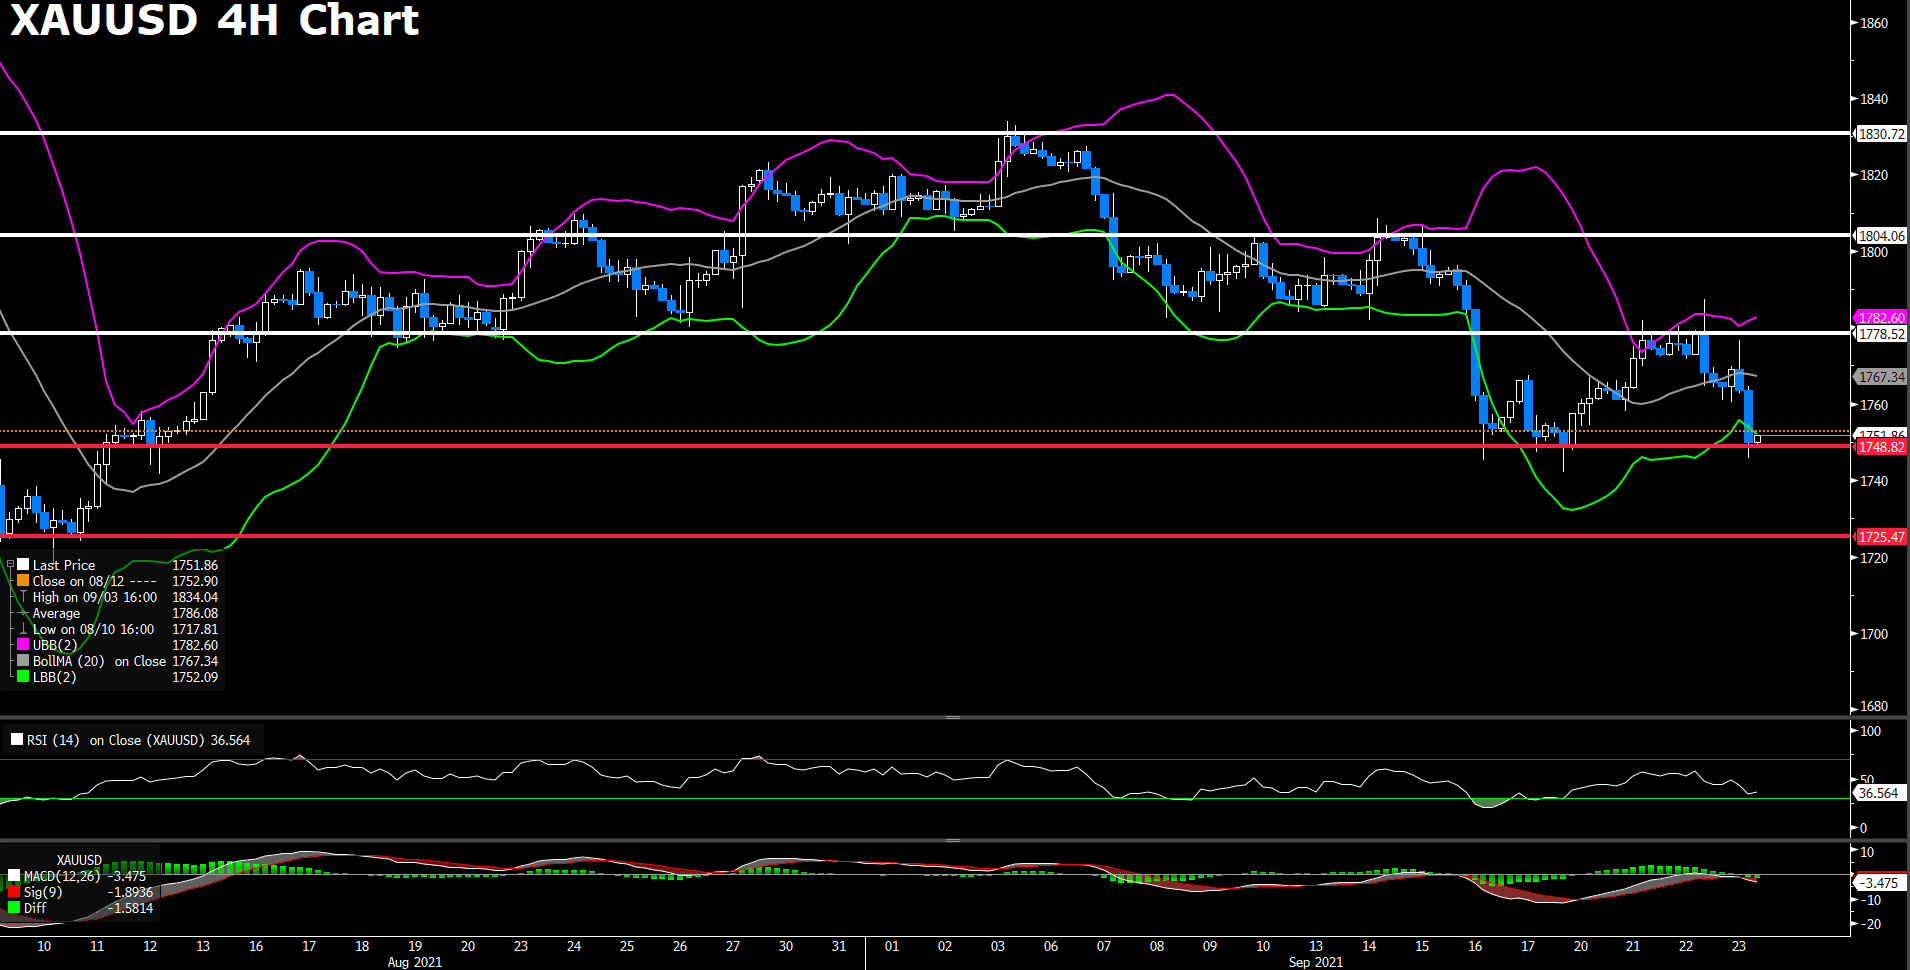
XAU/USD tumbled as equity markets heated up; furthermore, a weaker Dollar did not help the pair, as investors adopt the “risk-on” sentiment. Increasingly hawkish tone from the Fed and BoE did little to help gold as U.S. bond yields soared and flows redirected away from the non-yielding precious metal. Cash injection by the People’s Bank of China further eased equity investors’ concerns.
From the technical aspect, XAU/USD has found some support at the 1748 price level, but, if investors continue to move away from the safe haven asset, XAU/USD could trend down towards its next immediate support level of 1725. RSI for the pair sits at 36, as of writing, indicating modest over selling. The pair is trading below its 50, 100, and 200 day SMA.
Resistance: 1778.52, 1804.06, 1830.72
Support: 1748.82, 1725.47
Economic Data
|
Currency |
Data |
Time (GMT + 8) |
Forecast |
||||
|
JPY |
National CPI (MoM) |
07:30 |
– |
||||
|
JPY |
Services PMI (Sep) |
08:30 |
– |
||||
|
EUR |
ECB’s Elderson Speaks |
19:50 |
– |
||||
|
USD |
Fed Chair Jerome Powell Speaks |
22:00 |
– |
||||
|
USD |
New Home Sales (MoM) (Aug) |
22:00 |
714K |
||||