Daily Market Analysis
Market Focus
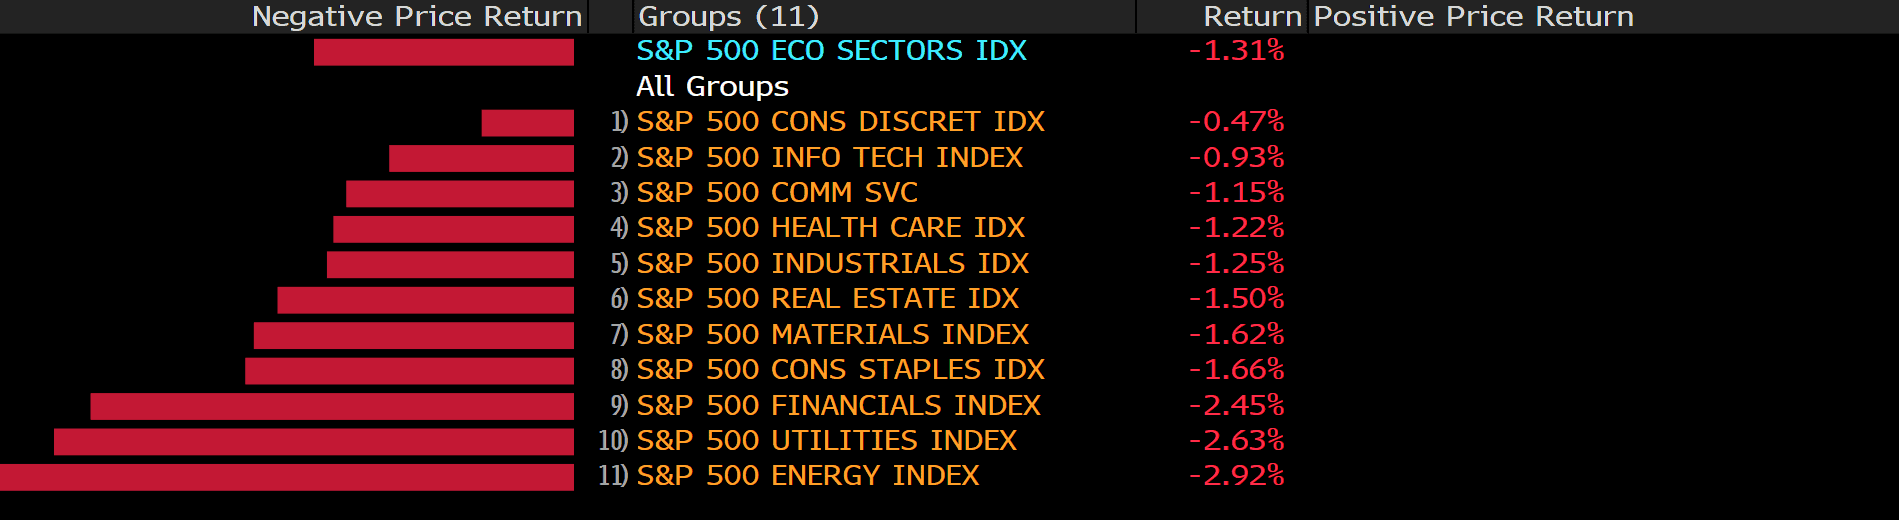
US equity market declined on four-consecutive days. The Dow Jones Industrial Average index suffered the most, dropped 1.58%. Meanwhile, the tech heavy Nasdaq and the S&P 500 index also fell 0.81% and 1.31% respectively. All sectors within the S&P 500 settled in the red.
The European Central Bank will allow banks to exclude deposits held at the central banks when calculating their leverage ratio until March next year. The ECB’s attitude toward a loose leverage ratio is a strong contrast to the US, which the Fed has ended a similar exemption in March. It further reveals European banks’ dependence on bank loans, rather than capital markets, as a source of corporate financing.
Michael Burry, one that is famous for winning bet against housing bubbles in 2008, has warned retail traders about “losses as the size of countries” in the event of crypto and meme-stock declines. “When crypto falls from trillions, or meme stocks fall from tens of billions, #MainStreet losses will approach the size of countries. History ain’t changed,” tweeted from Burry. Worth mentioning today is quad-witching day, with tons of stock and index options set to expire, options’ gamma will also deplete. It will take some time for gamma to refill, which leaves room for volatility to kick in.
Main Pairs Movement:
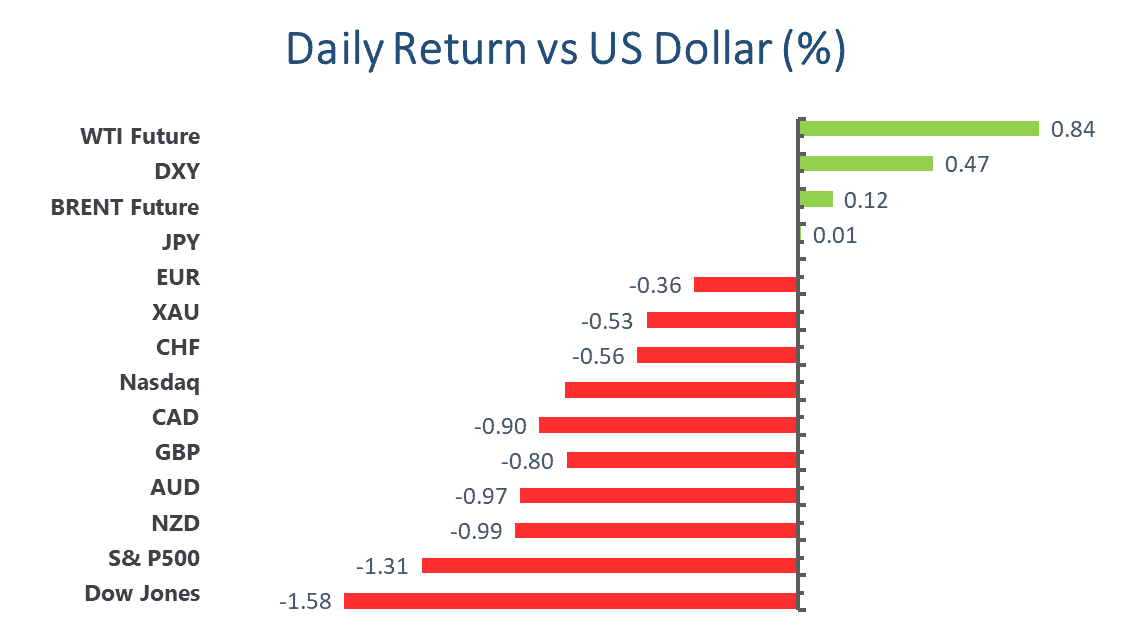
The US dollar rally continues on Friday, with the dollar index soared to 92.2 from pre-FOMC’s 90.5, refreshed the largest weekly gain since last March. Non-US currencies are flashing oversold across four-hour and daily timeframes, and we anticipate a cool off or rebound during next week’s trading.
All other major currencies were dropping against the dollar greenback on Friday except for the Japanese Yen. The 10-year US Treasury yields have been falling on Thursday and Friday, dipped total of 14 basis point to settle around 1.447%. It seems like investors are pricing in a high inflation in the near future as observed from a tightening in the 2- and 10-year bond yield spread. Short-dated bonds are less desirable if near term inflation remains high, the shift in demand from short-dated to longer term bonds will create downward pressure on long rates. With rates dropping in the long-end of the yields curve, carry trade investors want to undo their position, thus enhance the value of Japanese Yen.
Oil price continues to advance after a temporary pullback. With economic activities gradually return to pre-pandemic levels, demand for crude oil in either industrial or household use may outrun supply in the short term, therefore causing a surge in oil price. We may see yet accelerating upward momentum in fuel price as summer approaches. WTI and Brent crude oil gained 0.87% and 0.55% on Friday.
Technical Analysis:
XAUUSD (Daily Chart)
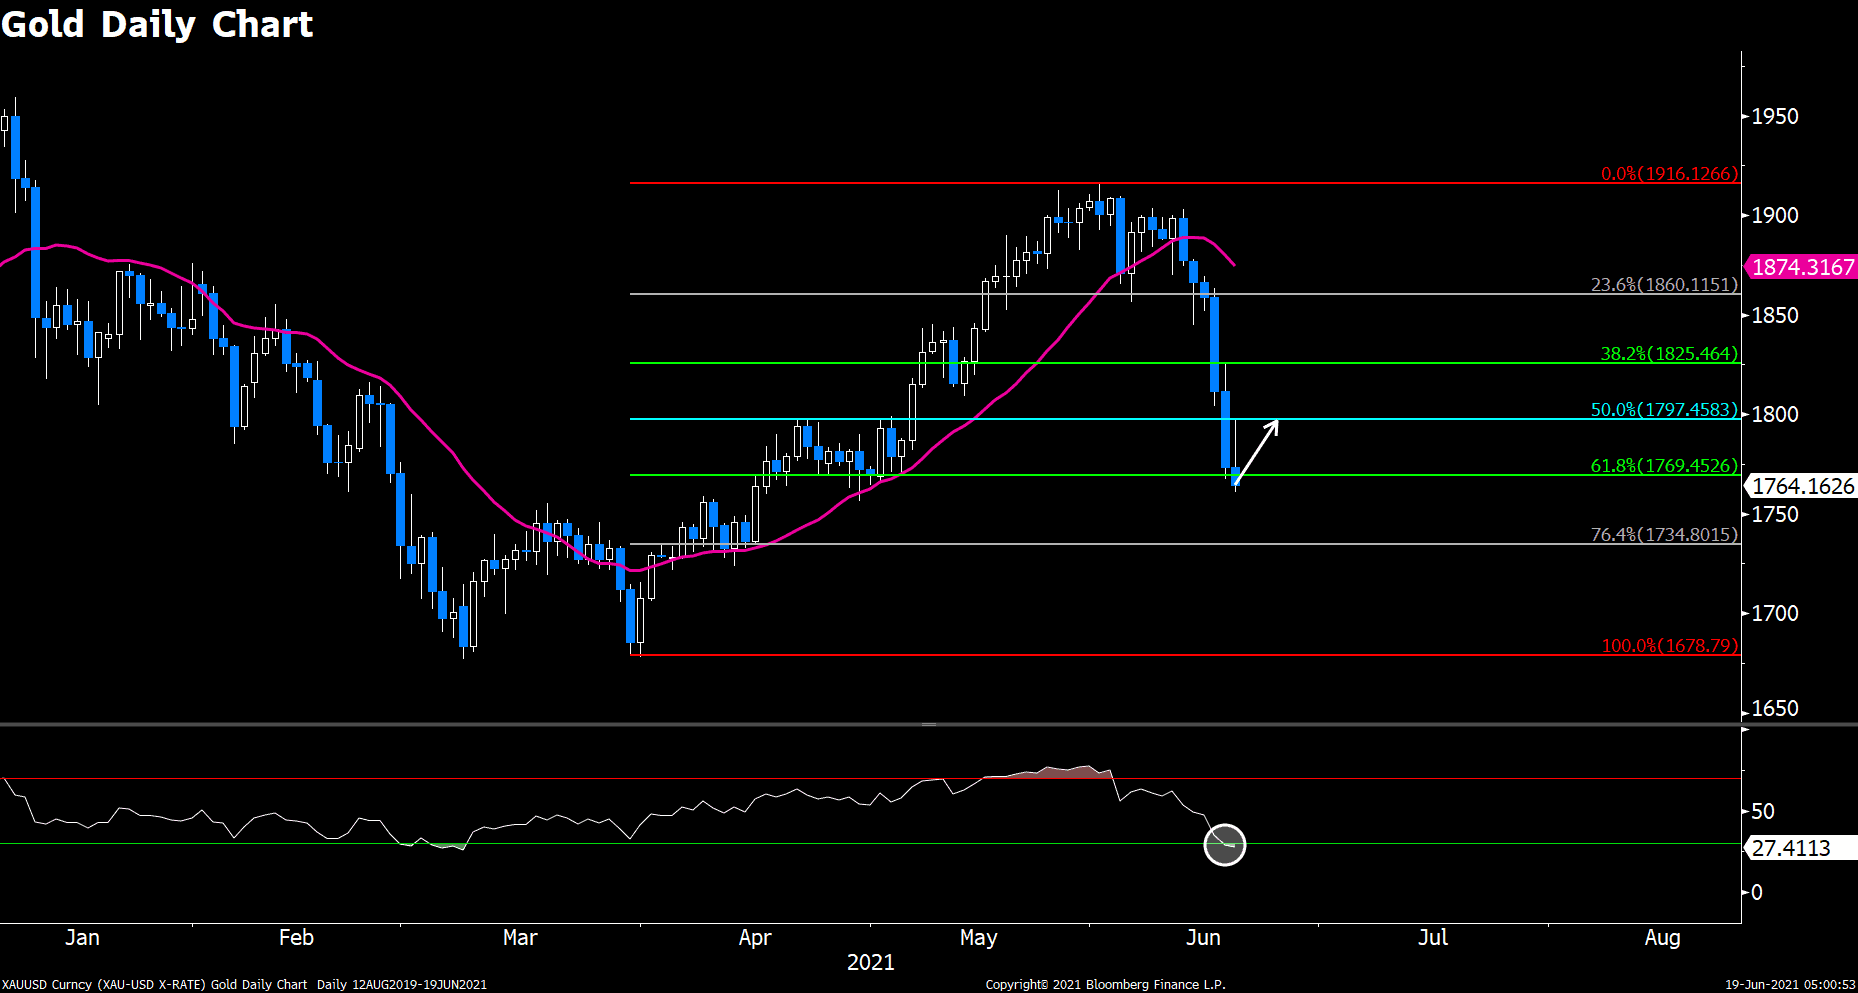
Gold looks to end its five-consecutive plunge after finding some support around $1770. The yellow metal rebounded to contest 50% Fibonacci level of $1798 earlier today, but the upward momentum quickly faded. Nonetheless, the sell off decelerated around $1770, and has hope to slowly recover some of its losses as daily RSI breaching oversold threshold, thus will prompt some profit-takings from sellers. The immediate resistance remains to be today’s high of $1798, followed by 1825. We cannot completely rule out a further plummet as current fundamentals are acting against inflation-hedge Gold.
Resistance: 1798, 1825, 1860
Support: 1770, 1734, 1680
USDCHF (Daily Chart)
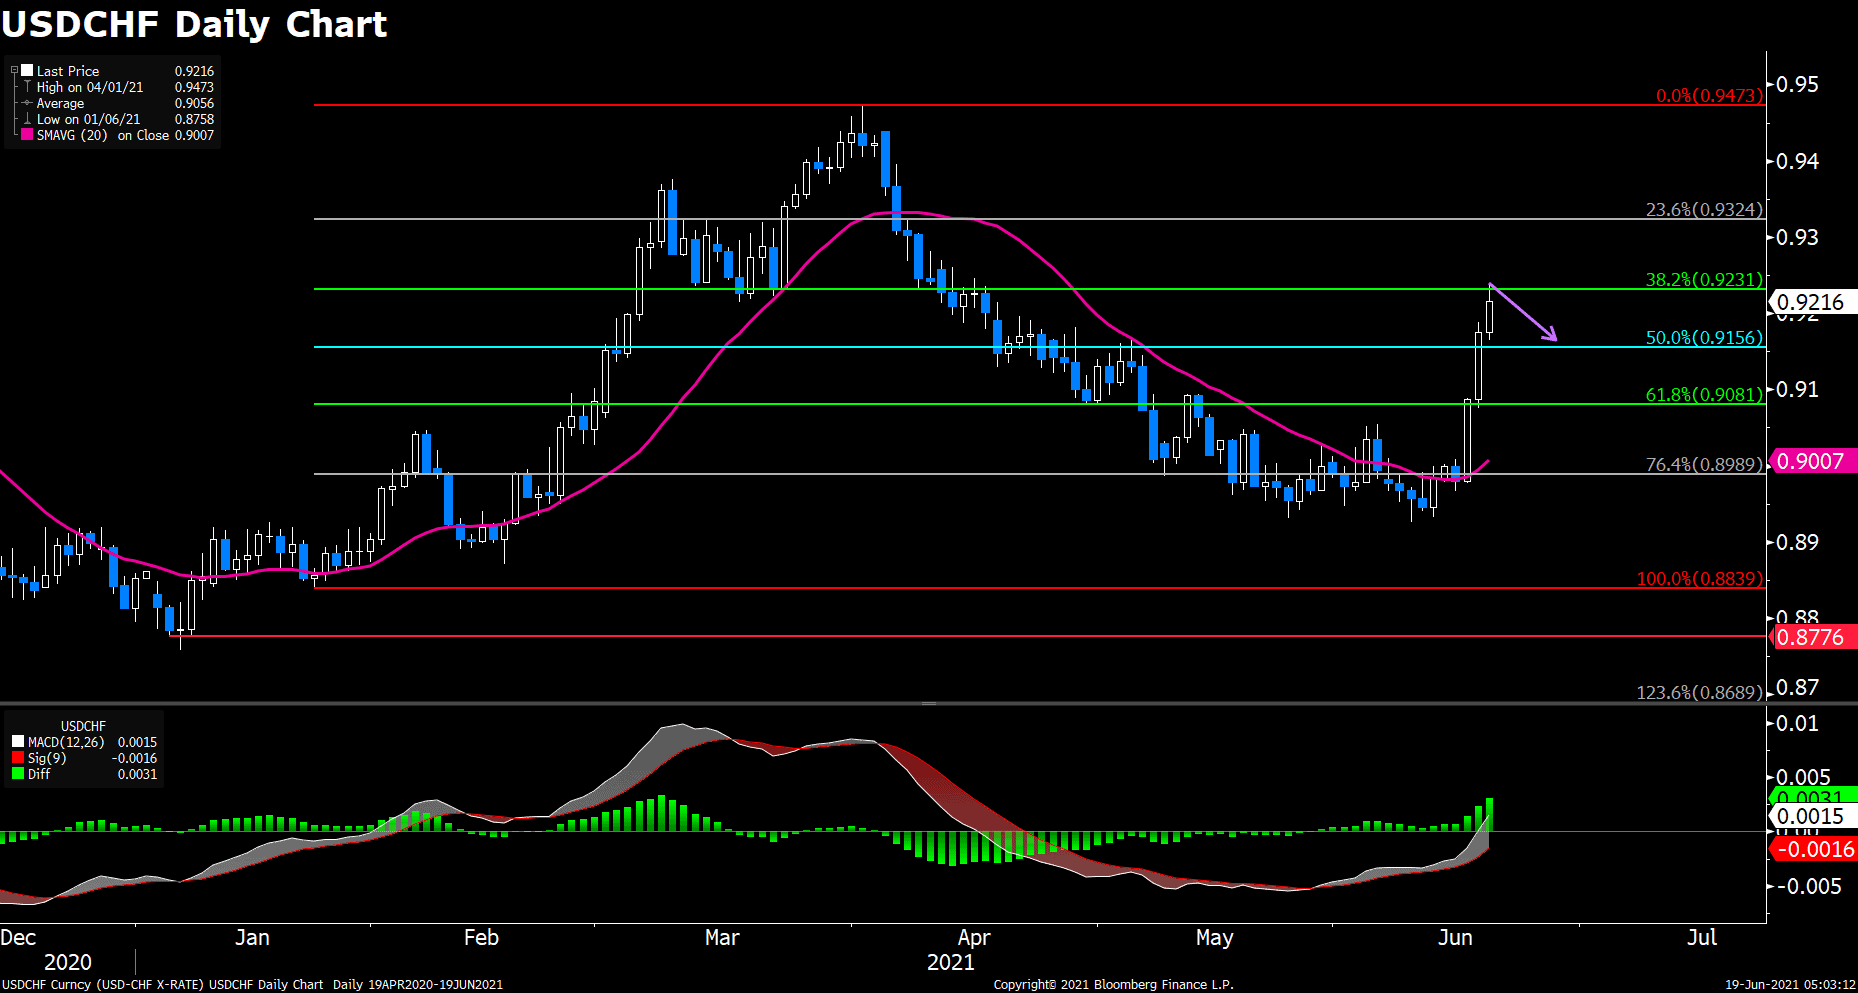
USDCHF lifted off post hawkish Fed announcement, appreciation in the last three days completely erased losses in the past two months. Multiple key resistance lines failed to contain the bulls, and price went straight to challenge March support line at 0.923, which also marks the 61.8% Fibonacci level. We expect some pullbacks to take place next week towards 0.9154, if breached then 0.908 may lend some support to the continuation of an uptrend. RSI is on the verge of a overbought zone, currently printing 69.3.
Resistance: 0.923, 0.932, 0.947
Support: 0.916, 0.908, 0.9
GBPUSD (Daily Chart)
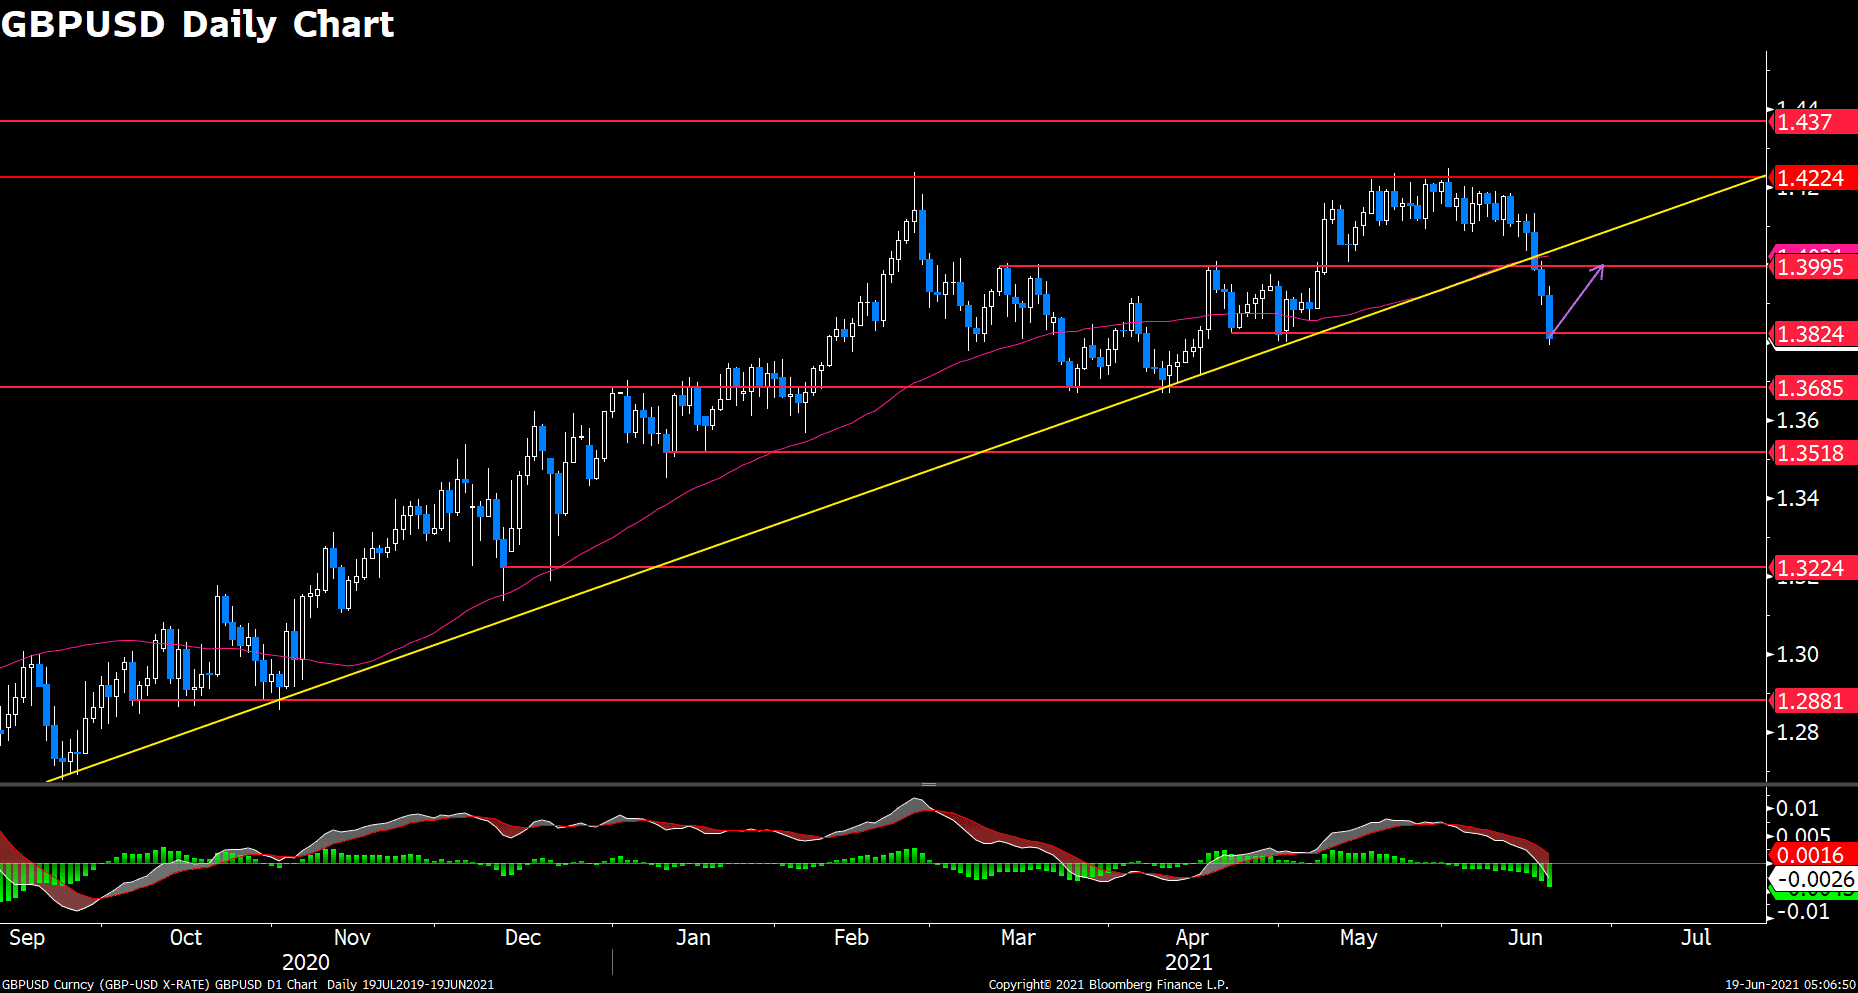
Cable officially ended its bullish trend which started from July 2020 by breaking a big ascending trendline. Price is currently finding ground at 1.38 handle, and we expect this pair to retrace upward to validate some of the key levels such as 1.389 and 1.396. The selling bias were certainly very strong this week given reopening concerns in the UK and the Fed’s surprise. However, UK remains to be top listed country to initial a full reopening, so investors need to keep a close eye on developments of the mutated virus in Britain. Any positive headline could easily boost Sterling, though it is unlikely to recapture the mentioned upward trendline.
Resistance: 1.4, 1.422, 1.437
Support: 1.382, 1.368, 1.352
Economic Data
|
Currency |
Data |
Time (GMT + 8) |
Forecast |
||||
|
GBP |
BoE Gov Bailey Speaks |
21:00 |
|||||