


Daily market analysis
May 4, 2021
Daily Market Analysis
Market Focus
Asian stocks look set to open modestly higher Tuesday after a muted session on Wall Street, where technology giants weighed on the market. The dollar dropped with Treasury yields.
Futures pointed higher in Australia and Hong Kong. Trading will be limited with Japan and China among markets closed for holidays. The S&P 500 Index closed near session lows, while Tesla Inc. and Amazon.com Inc. weighed on the Nasdaq 100. Benchmark 10-year Treasury yields dropped back to around 1.6% as Federal Reserve Chair Jerome Powell said the economic recovery remains patchy.
Commodities advanced, with silver leading gains in precious metals as the prospect of near-zero rates for longer boosted demand. Copper and oil climbed more than 1% amid broad rallies in energy and material stocks.
As a reminder of the fragility of economy and persist risks of excessive inflation, Monday’s data showed growth among U.S. manufacturers cooled in April, while a gauge of prices paid for materials jumped to the highest since 2008. Powell said progress in the recovery has been uneven across racial and income divides. New York Fed President John Williams said current conditions are “not nearly enough” for a shift in the monetary policy stance.
Main Pairs Movement:
The dollar lagged all its Group-of-10 currency peers as Treasury 10-year yields slipped following a report showing U.S. factory growth eased in April. The pound led gains, while the euro rose by the most in over a week.
Among G-10 peers, the Australian and New Zealand dollars were among the top three gainers as an index of commodities touched the highest since 2018.
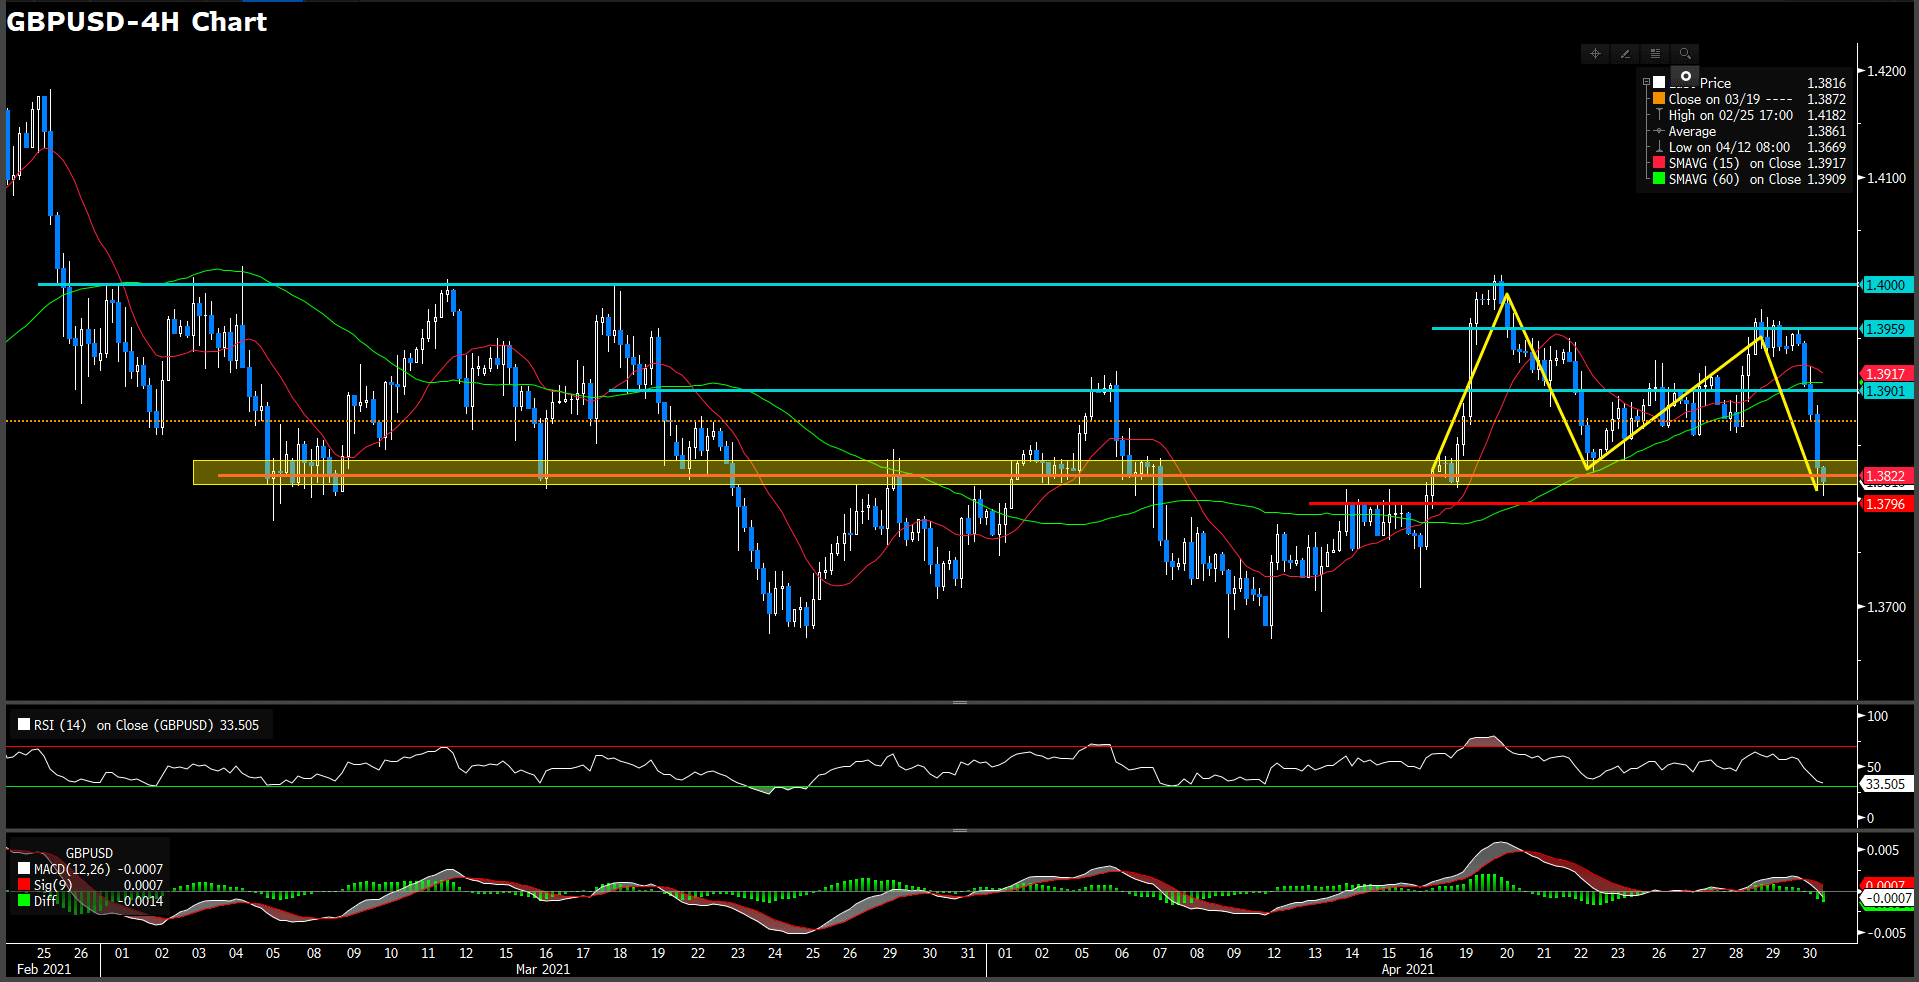
GBP/USD +0.6% to 1.3909; rose as much as 0.8%, the biggest jump since April 19. Pound buoyed by short-dated call demand and EUR/GBPsales ahead of Bank of England policy meeting later this week. Sizable GBP options expire Tuesday and Wednesday at strikes of 1.3800 and 1.4000.
EUR/USD +0.4% to 1.2065; advanced as much as 0.5%, the most since April 23; poised for the first gain in three sessions; climbed above its 100-DMA of 1.2055. Intraday resistance lies around 1.2080, April 20 high.
Technical Analysis:
XAUUSD (4 hour Chart)
XAU/USD pair has been pulled up on Monday while DXY index fell to 90.982 and most importanly that 10 year U.S. Treasury yields slipped over come to 2% in the day which spiraling at 1.6% which seems to be a critical support level, gold trading at 1792.79 as of writing. For RSI side, indicator shows 67.6 figures, suggesting a space for bearish momentum at least for short term interval. On average price view, 15-long SMA is holding a positive slope and 60-long SMA turned it slope to ascending way intraday market.
From price action perspective, it is obviously there has a 2-month long powerful resistance the currently market at 1800 around capping. Moreover, relative strong indicator shows market is close to over bought sentiment. Therefore, we expect gold has lot of chances will be stopped at first immediately resistance. However, if market penetrate the first resistance, 1812 following.
Resistance: 1800, 1812
Support: 1759.7, 1754.53, 1722.76
USDJPY (4 Hour Chart)
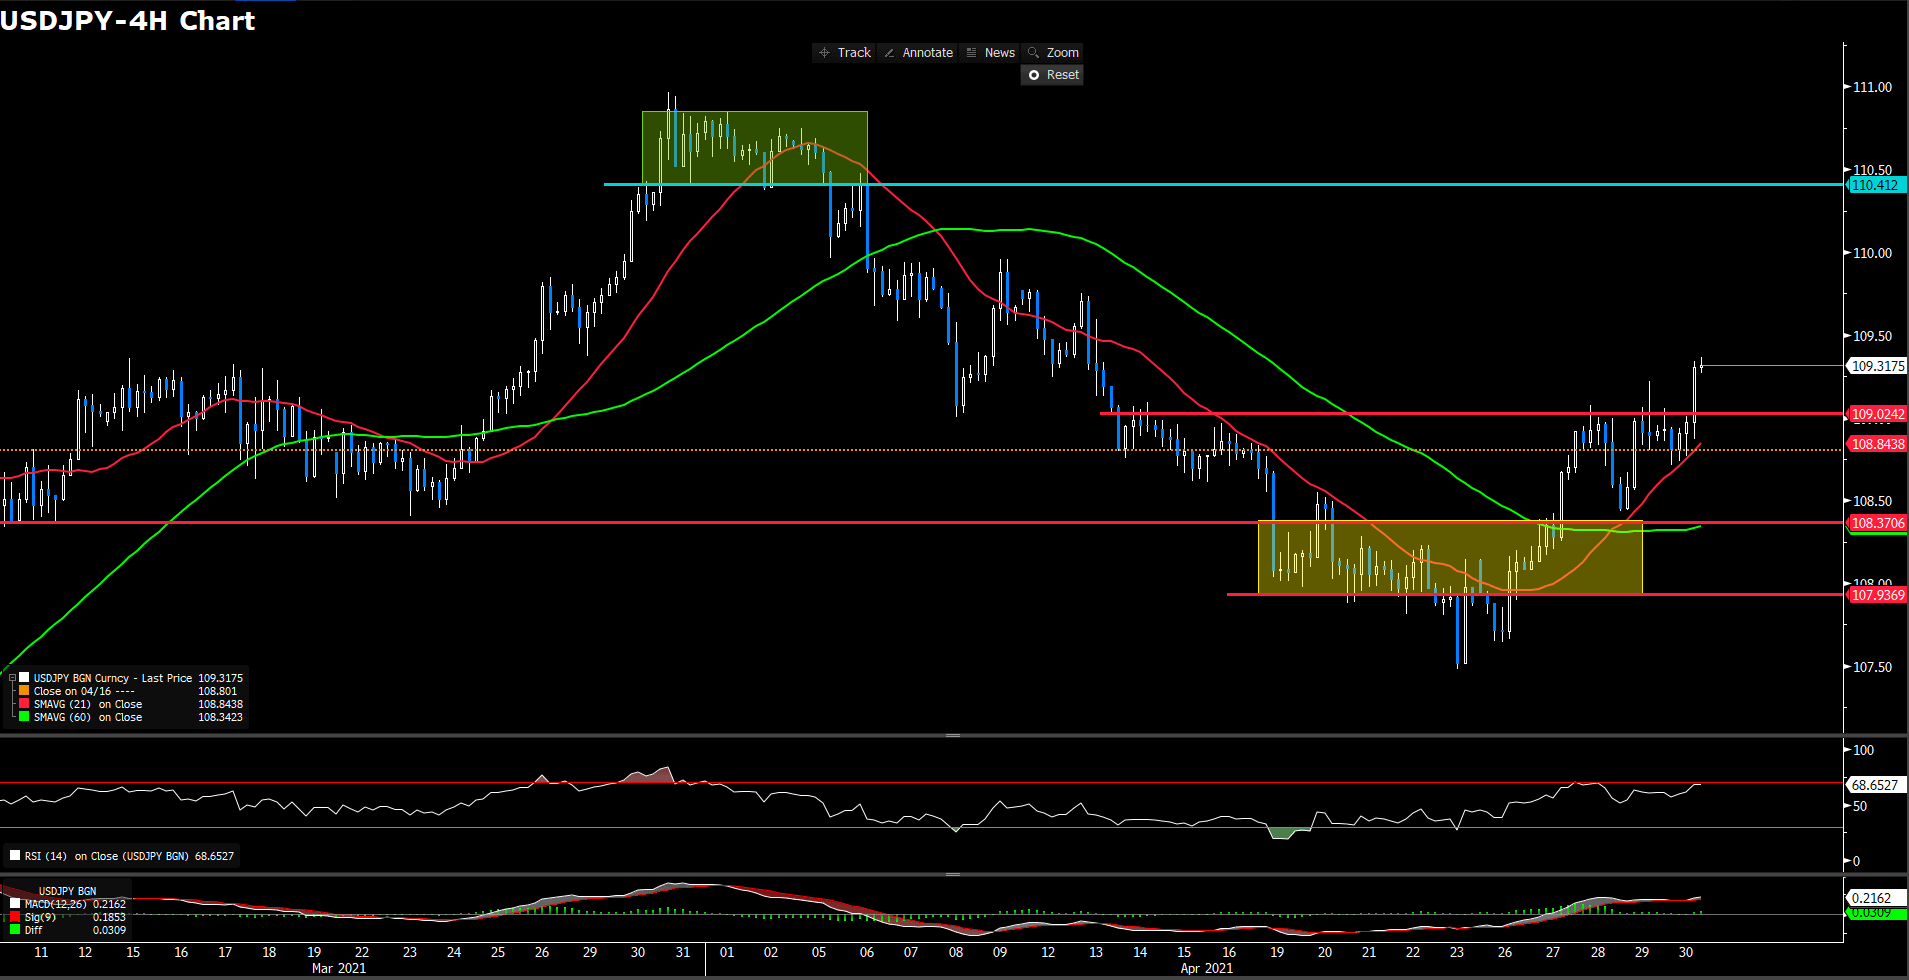
Japan yen have a correction in the day as U.S. ISM Manufacturing PMI exceedingly worst-than-expectation with 60.7 versus prediction with 65. Intraday, market once edge up to recently high at 109.65 around then fell to test the firs immediately psychological support level at 109, trading at 109 as of writing. For RSI side, indicator has tamp down to 52 figures, which suggest a neutral market sentiment. On the other hands, 15 and 60-long SMAs indicator are retaining it ascending movement notwithstanding seems to lose accelerating traction.
In the lights of phenomenon, we expect market will lose a significant direction if it keep clinging at first support level. For upward favour, 109 level is immediately need to be defend naturally and 108.37 following
Resistance: 110.412
Support: 109, 108.37, 107.936
USDCAD (Daily Chart)

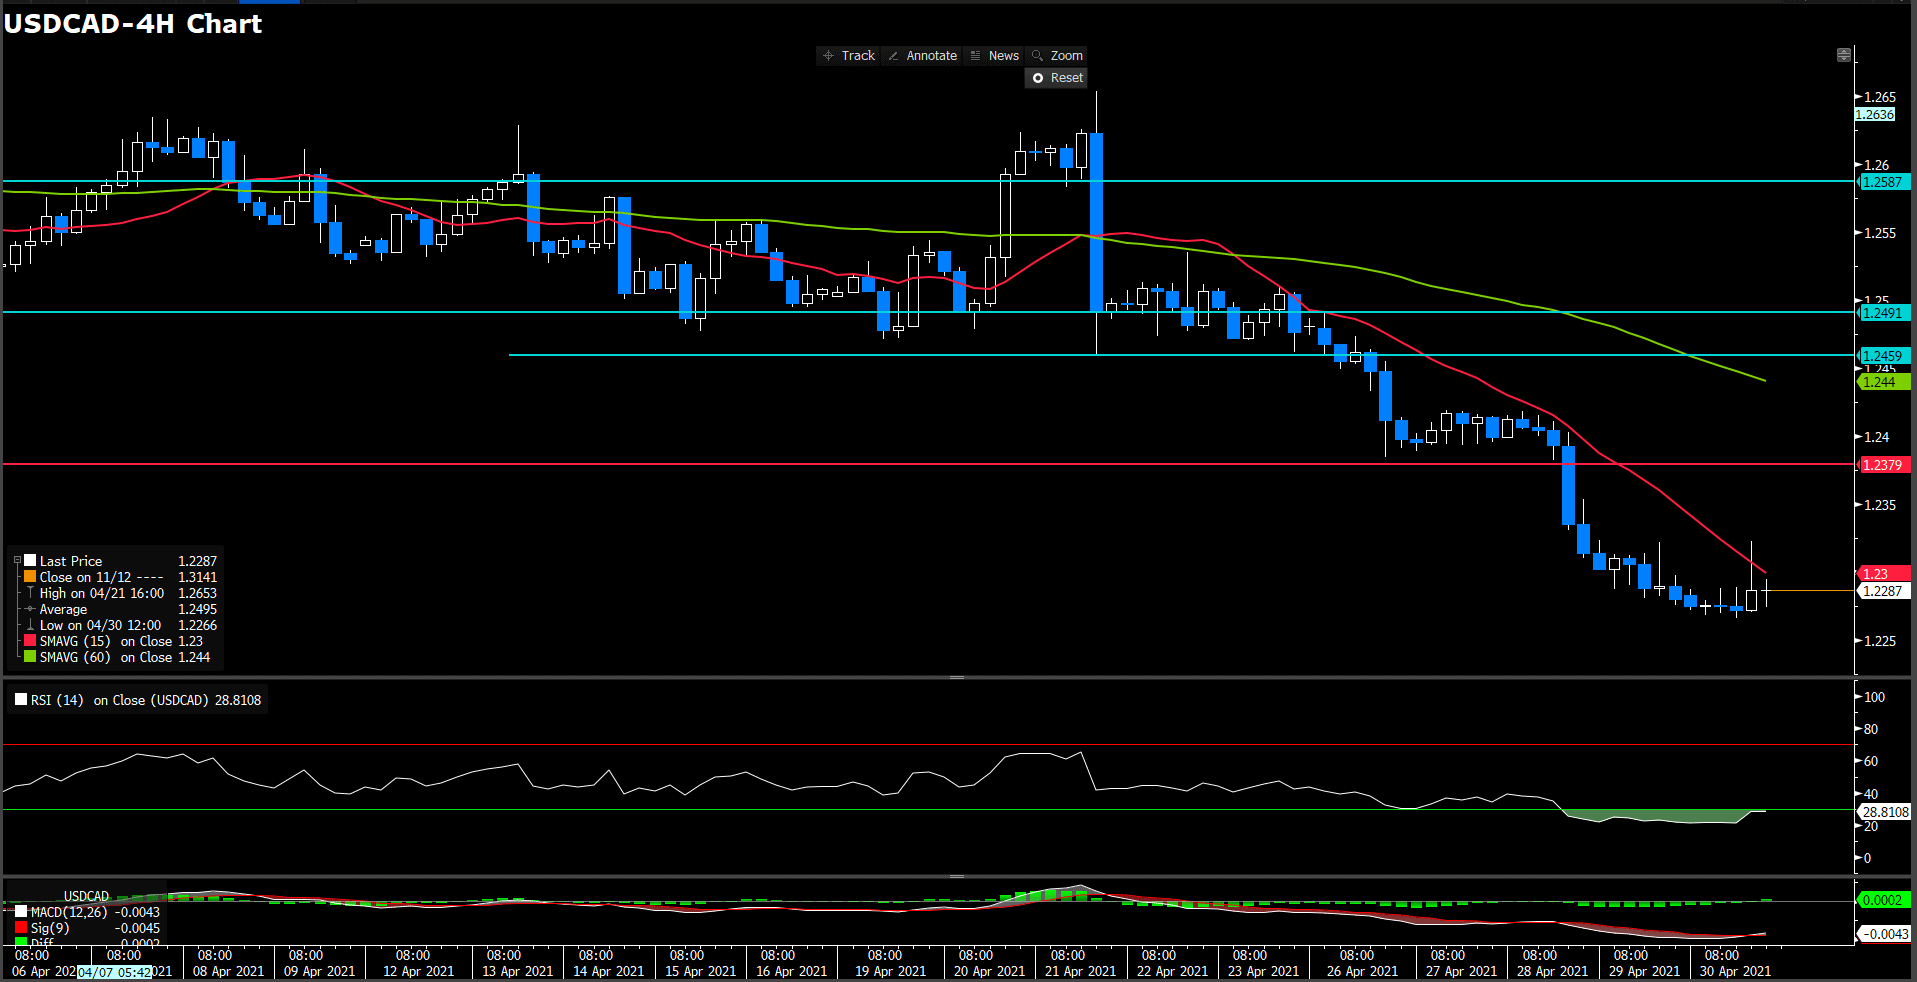
After trading around 1.23, loonie sucessive depressed around 1.2276. It slipped 0.14% in the day, amid WTI crude oil price bust out to recently high that rallied over 1.6% to 64.48, trading at 1.227 as of writing. The immense of selling pressure surrounding the greenback seems to be forcing loonie to tamp lower. At the meantime, the Canadian manufacturing sector continue to expand in Apr, albeit at a slower pace than March, data edging lower to 57.2 from last month 58.5. For RSI side, indicator bounced back from over sought zone to 34 figures which still suggesting a bearish momentum ahead for short term. On averaging price perspective, 15-long SMA indicator turn it slope to flatter movement while 60-long SMA indicator remaining descending slope.
Overall, if market not retesting the first resistance, we expect loonie will remain it bearish momentum for long term.
Resistance: 1.238, 1.246, 1.2491
Economic Data
|
Currency |
Data |
Time (GMT + 8) |
Forecast |
||||
|
NZD |
Employment Change (QoQ)(Q1) |
06:45 |
0.2% |
||||
|
NZD |
RBNZ Gov Orr Speak |
07:00 |
– |
||||
|
USD |
ADP Nonfarm Employment Change |
21:00 |
805K |
||||
|
USD |
ISM Non-Manufacturing PMI (Apr) |
22:00 |
64.3 |
||||
|
OIL |
Crude Oil Inventories |
22:30 |
-2.191 M |
||||
-
Global - English

-
United Kingdom - English
-
France - Français

-
Spain - Español

-
Portugal - Português

-
Italy - Italiano

-
Germany - Deutsch

-
Turkey - Türkçe

-
MENA - العربية

-
MENA - English
-
Asia - English
-
India - English

-
Indonesia - Indonesia

-
Japan - 日本語

-
South Korea - 한국어

-
Malaysia - Bahasa Malaysia

-
Malaysia - English
-
Philippines - English

-
Vietnam - Tiếng Việt

-
Thailand - ไทย

-
China - 简体中文

-
China - 繁體中文

This site uses cookies to provide you with a great user experience.
By using vtmarkets.com, you accept
our cookie policy.
Start trading with
VT Markets today


![]()
Follow us on:


![]()


