


Daily market analysis
April 15, 2021
Daily Market Analysis
Market Focus
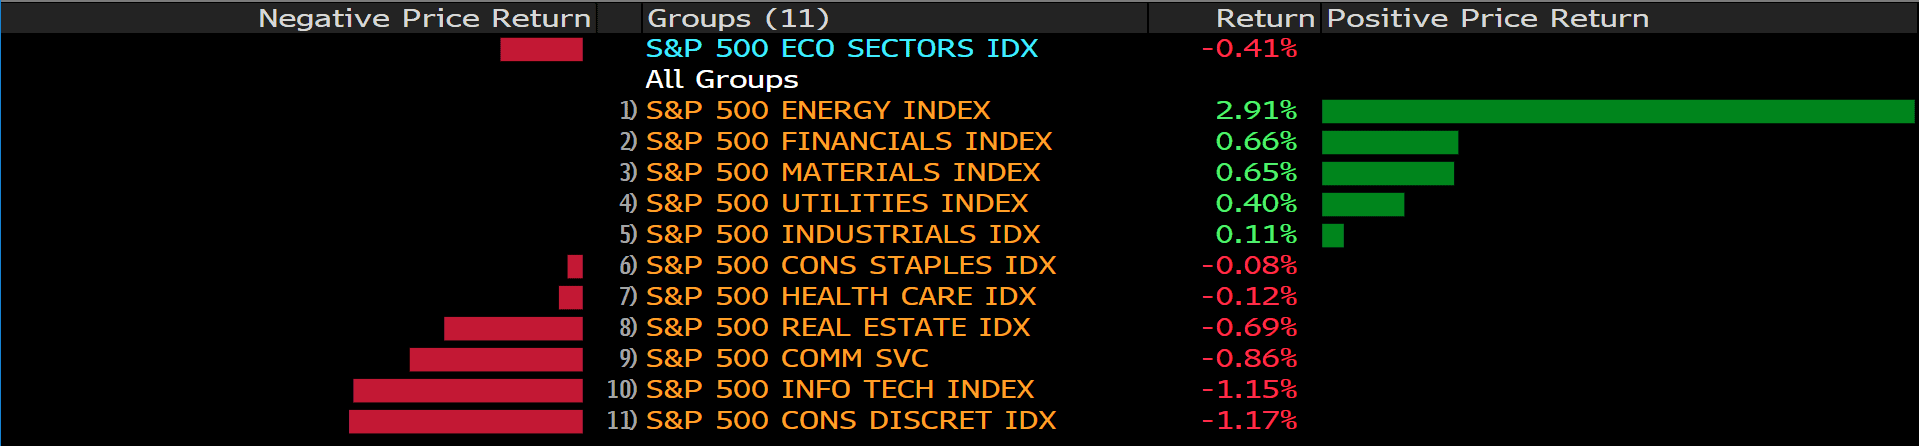
U.S. stocks retreated after climbing to an all-time high. Treasuries fell with the dollar. Oil rallied.
PayPal Holdings Inc. and Nvidia Corp. paced losses among tech companies in the S&P 500, which had fluctuated for much of Wednesday’s session as traders sifted through earnings from some of the world’s biggest banks. Bitcoin slid in the wake of the debut by currency company Coinbase Global Inc. on the Nasdaq.
With equities lingering near a record, investors are looking to the earnings season for further catalysts. Expectations of a strong profit rebound have helped markets rally, setting the bar high as reporting gets underway. More broadly, investors are monitoring vaccine developments for any threats to the economic recovery. The Federal Reserve said in its Beige Book that activity has picked up pace amid an improvement in consumer spending.
A quarter that began with retail investors declaring the end of the status quo on Wall Street just ended with big banks tallying surprisingly massive hauls. Goldman Sachs Group Inc. and JPMorgan Chase & Co. — two of the most gilded names in finance — kicked off bank earnings season with revenue windfalls from trading and deal making, defying warnings from within the industry that good times couldn’t last
Market Wrap
Main Pairs Movement:
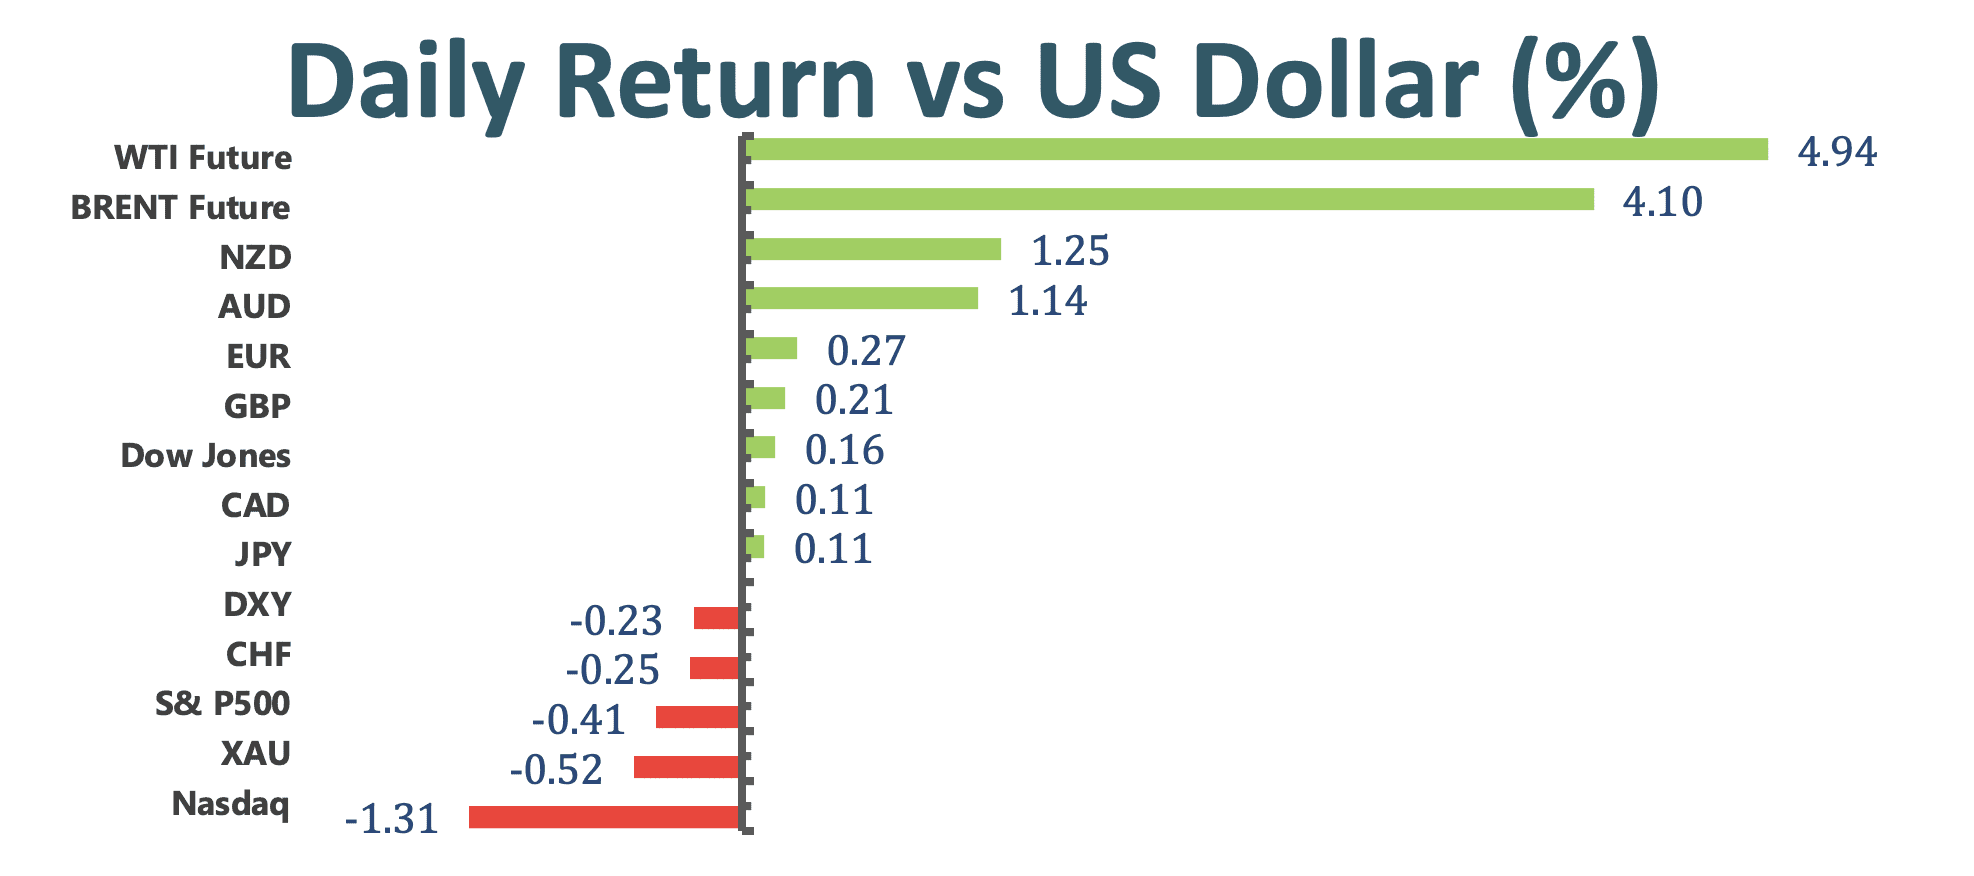
The dollar weakened versus most of its Group-of-10 peers as solid earnings from U.S. banks including Goldman Sachs and JPMorgan sapped demand for havens. Commodity-linked currencies jumped in tandem with oil and copper. U.S. equities retreated from record highs as a sell-off in Coin base dragged the asset class lower. The dollar also remained under pressure as Fed chair Jerome Powell said the central bank is waiting on price, job outcomes before any hikes.
The New Zealand and Australian dollars topped Group-of-10 peers as an index of commodities touched the highest in four weeks. EUR/USD rises 0.3% to 1.1983; touched 1.1987, highest since March 18; eyes resistance at 1.20. GBP/USD +0.3% to 1.3791; rose as much as 0.4% to touch the highest in a week; pound sees corporate activity around the 1.3780 level as mid-month flows materialize. USD/JPY -0.1% to 108.95; breached support at 109 to touch 108.75, lowest since March 25.
Technical Analysis:
EURUSD (4-hour Chart)
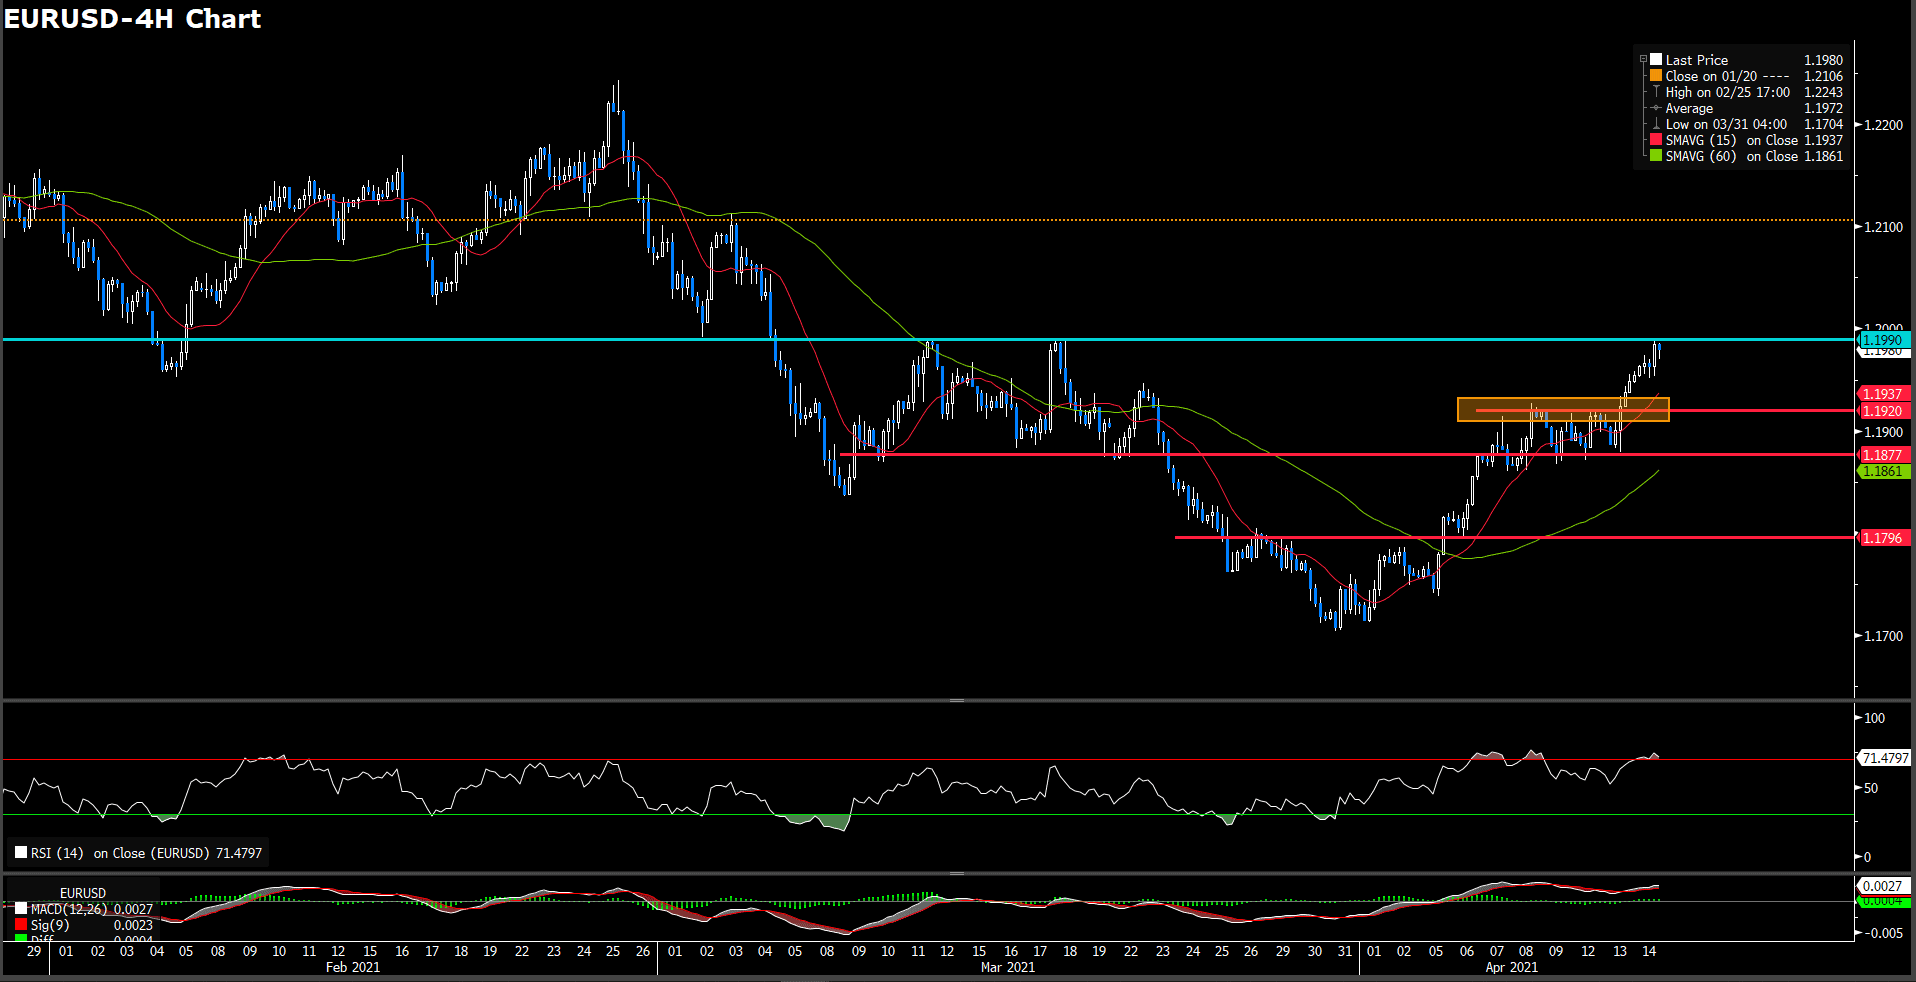
Euro dollar edged up to one-month heigh as well as perfect shoulder resistance of W bottom pattern which 1.1990, slightly down to 1.1979 while market close. At current stage, RSI indicator has breached over bought area to 70.7 figure, suggesting a torrid market momentum.
Moreover, 15 and 60-long SMAs indicator are both setting a ratchet up status. Therefore, combing mixed suggestion above, we expect market could slightly correct currently bullish movement in narrow space which linger between 1.192 and 1.1990. On slid side, 1.192 should be the first support level as head of price cluster for nearly short run, 1.1877 following behind as long run price cluster.
Resistance: 1.199
Support: 1.192, 1.1877, 1.1795
AUDUSD (4-hour Chart)
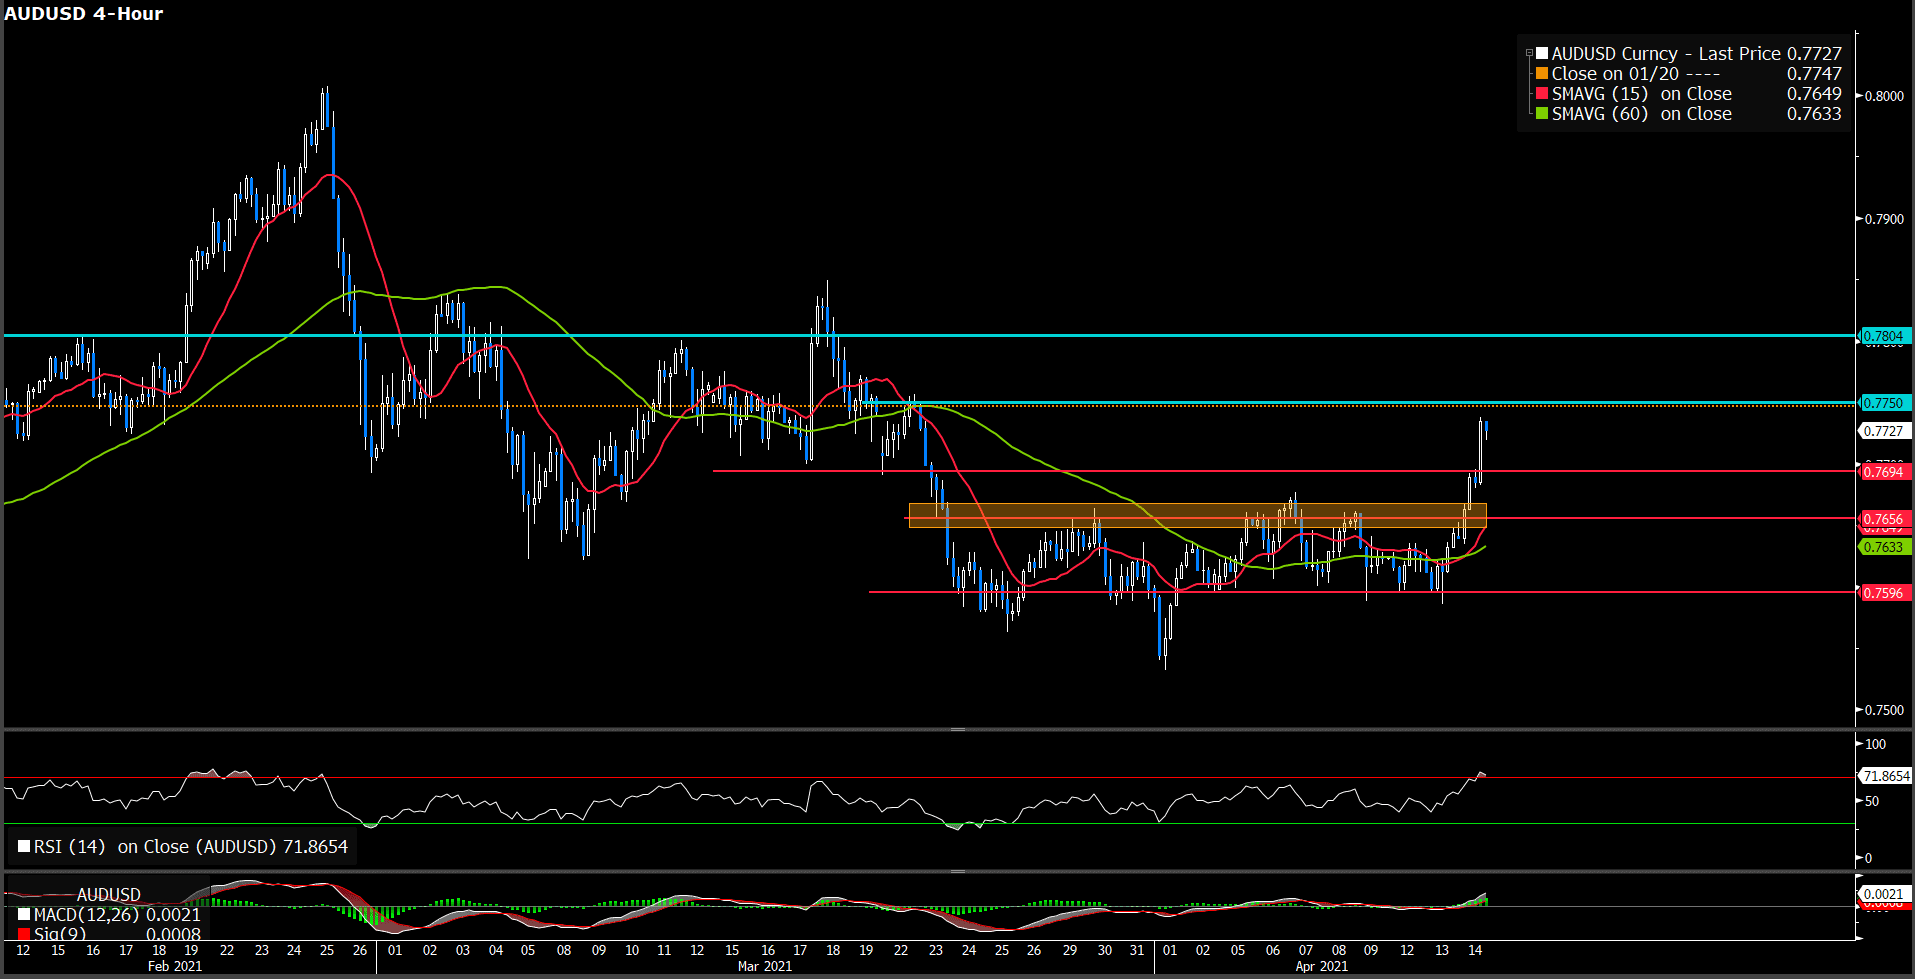
Once Aussie breakthrough a day-long consolidation in the day market, pair propeled to recently high at 0.7732, trading at 0.7723 as market close. Market fully driven by inflation expection amid U.S. infrustruction plan and prosperity of commodities market. For a critical indicator, 15 and 60-long SMAs has golden cross intraday market which both of them are in an ascending momentum. On the other hands, RSI indicator has approached over bought zone at 72 figure, which denote a binge sentiment. We believe Aussie remaining a rising market for long term perspective pursaunt the terms of aforementioned suggestion.
Resistance: 0.775, 0.78
Support: 0.7694, 0.7656, 0.795
XAUUSD (Daily Chart)
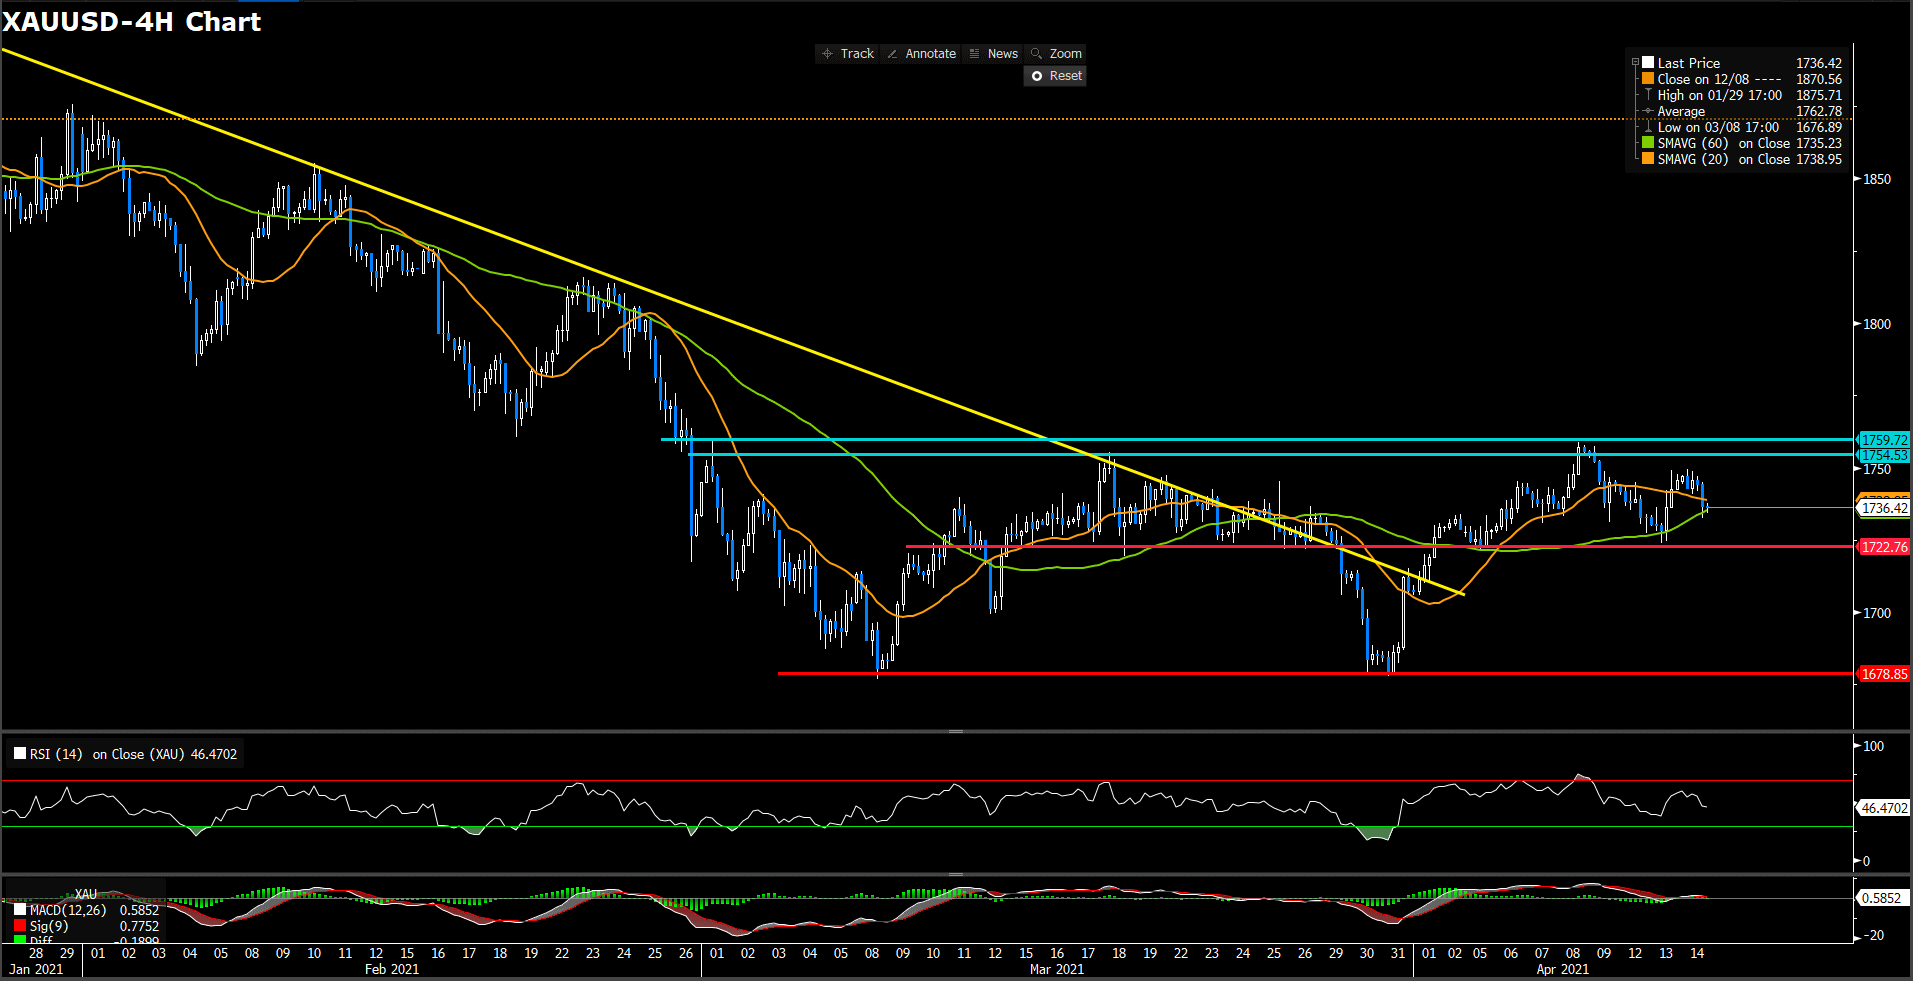
Gold has been slapped by market even market is wagering in inflation hope, currently trading at 1736.4. For RSI view, indicator set 46 figure which suggest a neutral-to-bearish movement at least in short term. On moving average indicator, 15-long SMAs turn south but 60-long SMAs remaining upward trend which give a roam move suggestion. In the lights of suggestion and price action, we expect market will continue neutral momentum in short term which price target in wide range between 1722.75 and 1754.5. For bullish favorable, price should stand above 1754.53 level even further where deem a cogent shoulder of “bottom pattern”.
Resistance: 1754.53, 1759.72
Support: 1722.75, 1678.85
Economic Data
|
Currency |
Data |
Time (GMT + 8) |
Forecast |
||||
|
AUD |
Employment Change (Mar) |
09:30 |
35 k |
||||
|
USD |
Core Retail Sales (MoM)(Mar) |
20:30 |
5% |
||||
|
USD |
Initial Jobless Claims |
20:30 |
700 k |
||||
|
USD |
Philadelphia Fed Manufacturing Index (Apr) |
20:30 |
42 |
||||
|
USD |
Retail Sales (MoM)(Mar) |
20:30 |
5.9% |
||||
-
Global - English

-
United Kingdom - English
-
France - Français

-
Spain - Español

-
Portugal - Português

-
Italy - Italiano

-
Germany - Deutsch

-
Turkey - Türkçe

-
MENA - العربية

-
MENA - English
-
Asia - English
-
India - English

-
Indonesia - Indonesia

-
Japan - 日本語

-
South Korea - 한국어

-
Malaysia - Bahasa Malaysia

-
Malaysia - English
-
Philippines - English

-
Vietnam - Tiếng Việt

-
Thailand - ไทย

-
China - 简体中文

-
China - 繁體中文

This site uses cookies to provide you with a great user experience.
By using vtmarkets.com, you accept
our cookie policy.
Start trading with
VT Markets today


![]()
Follow us on:


![]()


