


Daily market analysis
March 19, 2021
Daily Market Analysis
Market Focus
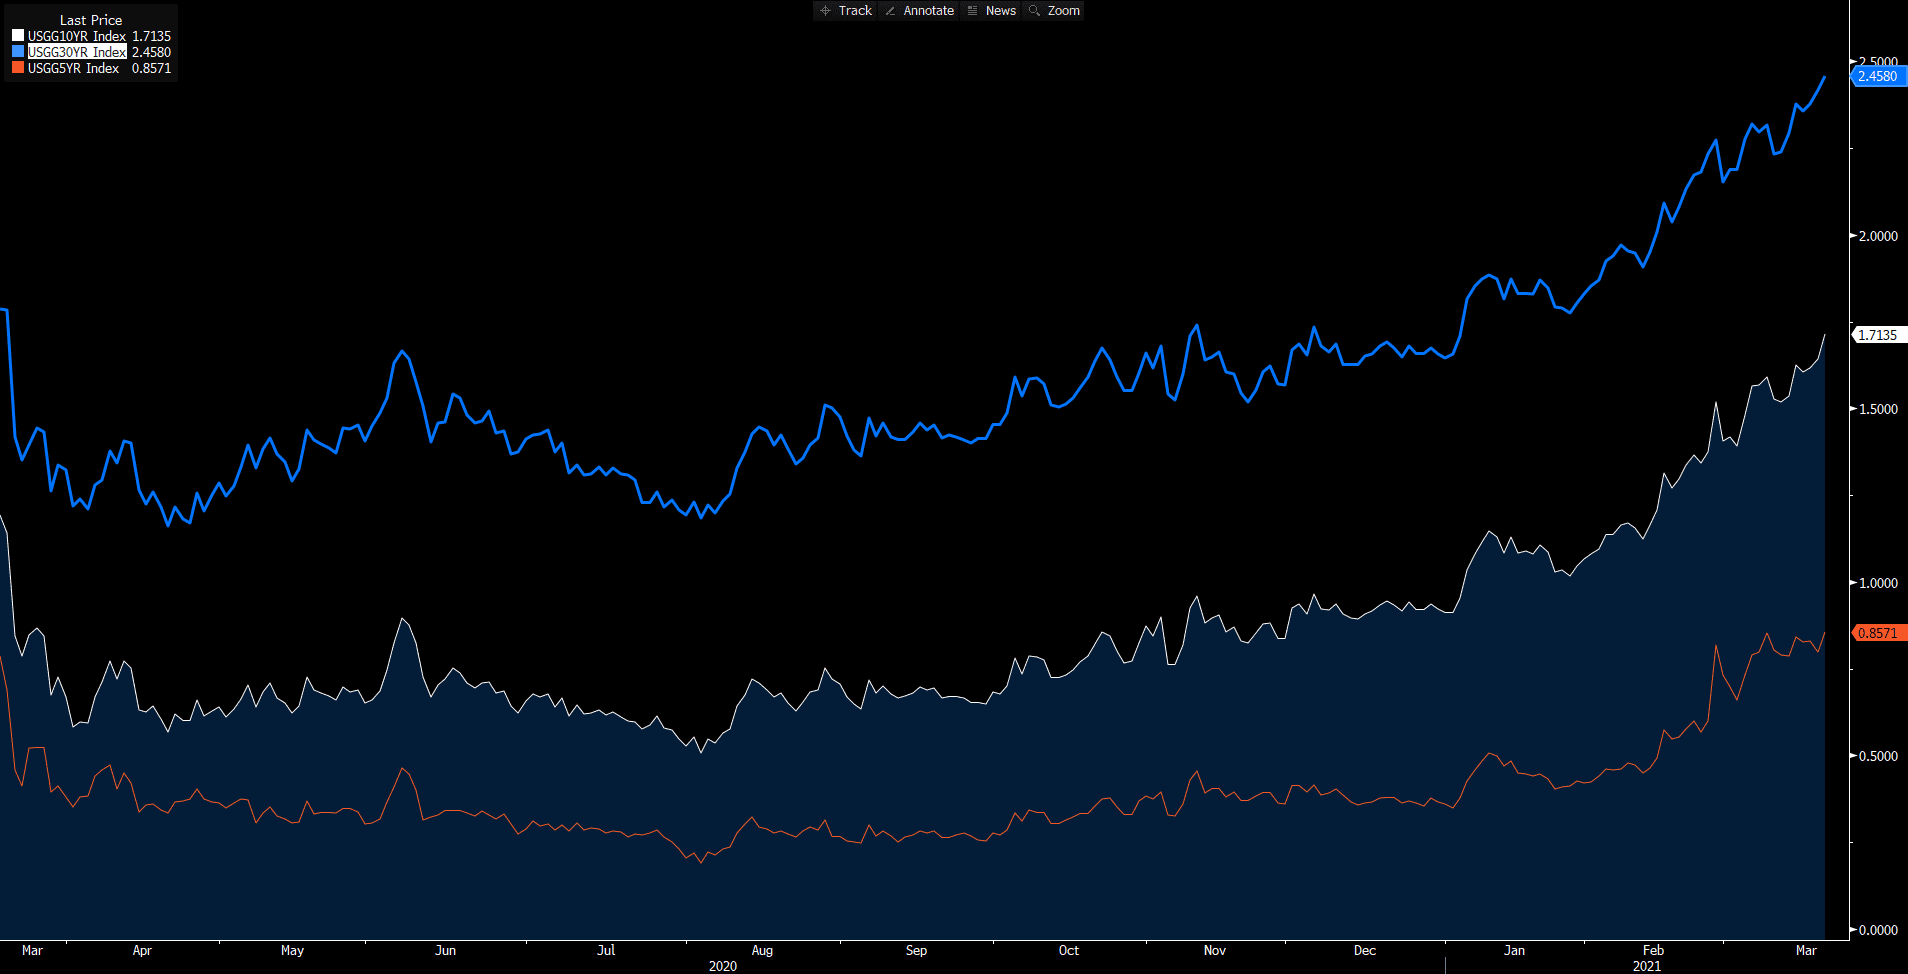
In the US market, Nasdaq fell as the US Treasury yields hit another highest level in more than a year amid the concern of letting inflation accelerate after the FOMC. The 10- year US Treasury hiked to as high as 1.75% for the first time since January 2020 even though the Fed has announced that currently there is no plan to rise interest rates anytime soon until 2023. In the meantime, the 30- year yield has breached 2.5% for the first time since August 2019. Jerome Powell appears to be willing to keep pumping support into the economy and let it run hotter on a fast-paced growth and inflation.
Japan’s central bank planned to carry out monetary policy adjustments designed to increase its flexibility for financial institutions. Bank of Japan considered to be looking at measures that widen the fund rates move in slightly larger range of 0.25%. With this consideration, it not only can maintain low interest rates, but also give financial institution a chance to increase revenue.
The Bank of England decided to keep interest rates unchanged on the future monetary policy. As a response, the UK bond yields moved higher on expectations of rising inflation. Moreover, BOE reassured that a tightening monetary policy won’t happen until a clear evidence of an economy recovery.
Market Wrap
Main Pairs Movement
Gold declined as the US Treasury yields reached to highest in more than a year. In response to the climbs in the yields, most metals fell. As Jerome Powell mentioned, inflation is likely to be transient, and will not mark progress toward the Fed’s long- term goals. With this, the Fed has no intention to push back against the surge in Treasury yields. In the meantime, holdings in ETF have gradually fallen in every session since February for the longest decline on record. With the combination of the selloff from ETFs and the surge in Treasury yields, gold is heading to a bearish trend.
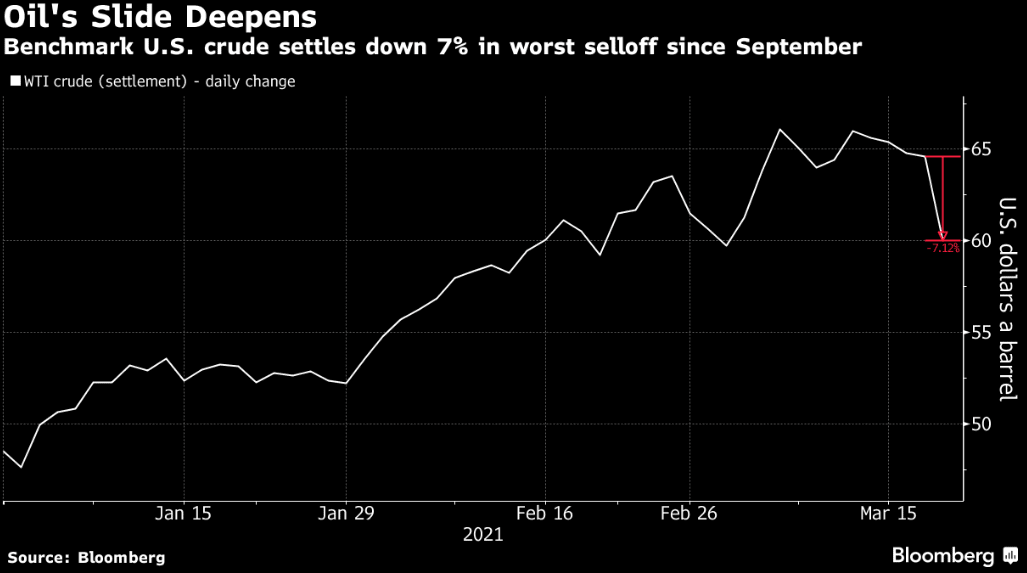
Crude oil lost around 7% today, settling at $60 a barrle amid the concern over short- term demand and as a strong US dollar weakened commodities priced in the currency. The selloff was the biggest since September.
Technical Analysis:
XAUUSD (Daily Chart)
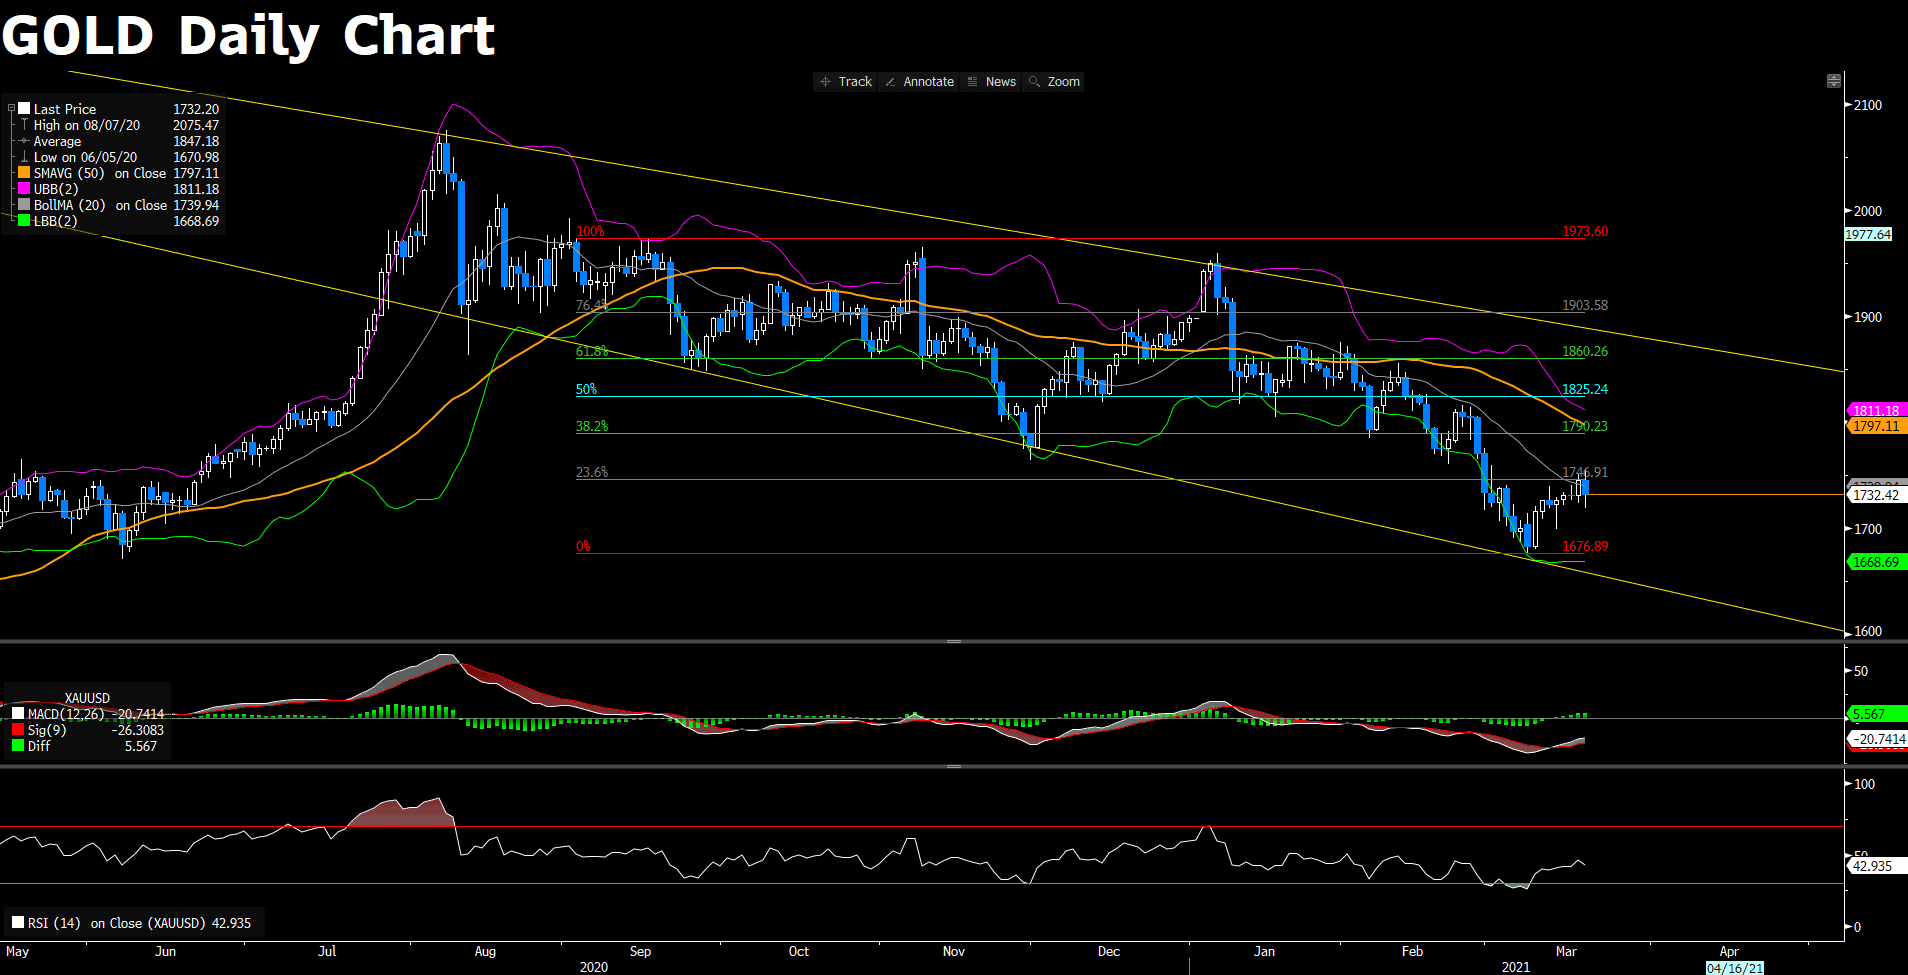
After riding with the FOMC news, contesting the resistance at 1746.91(Fibonacci 23.6% retracement,) gold turns to bearish trend as it fails to break through. At the same time, the bullish- to- bearish momentum is confirmed as the MACD indicator narrows down, and the RSI continues to stay in neutral, implying that there is still more room for the pair to the downside. The next target for gold is expected to sit around the support level at 1676.89(Fibonacci 0% retracement.) if gold successfully breaks the strong support level at 1676.89, then it will open up an accelerating downside pressure.
Resistance: 1746.91, 1790.23, 1825.24
Support: 1676.89
EURUSD (Daily Chart)
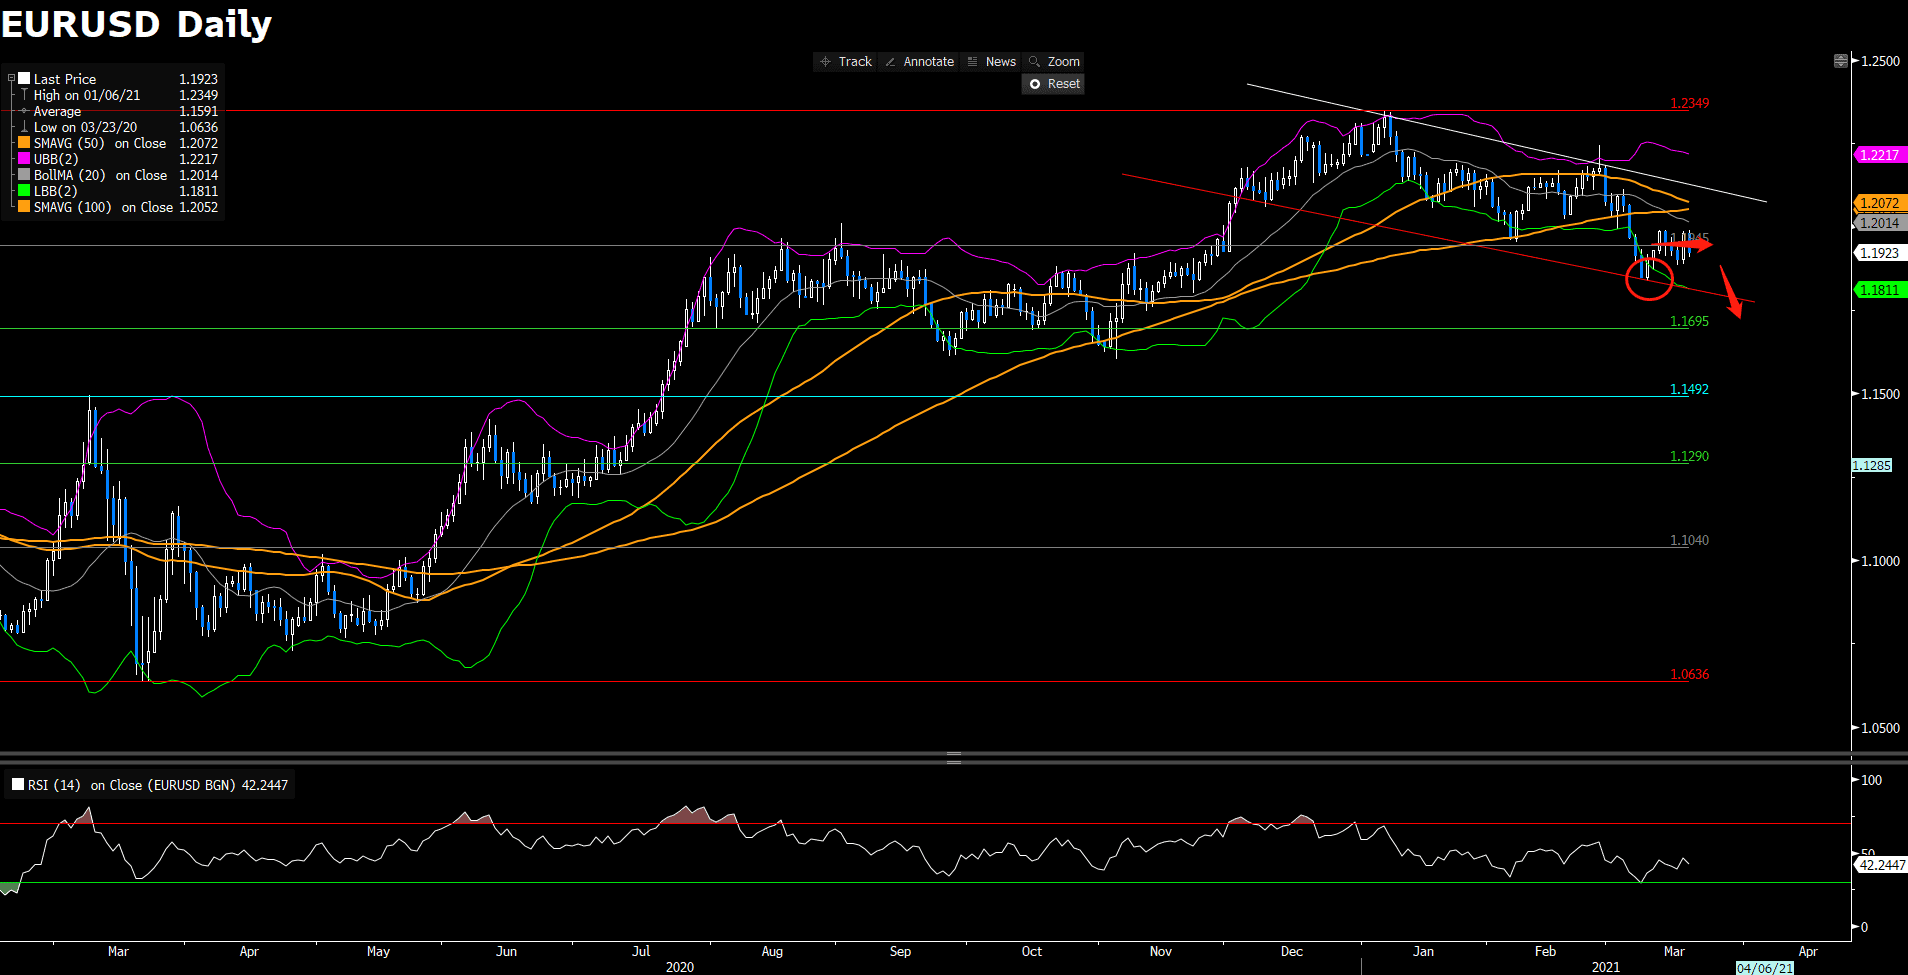
EURUSD drops toward 1.1900 as US dollar index recovers with the US bond yield continues to surge, currently trading around 1.1925. On the daily chart, EURUSD continues to trade within the descending channel; at the same time, it is located below the 50- and 100- SMA, indicating a bearish mode. However, the RSI indicator stays in a neutral situation, suggesting that there is room for the pair to climb or drop. However, after turning into a positive mode from the descending trend, the pair has hovered around the resistance for a while, implying that the pair might not have enough boost to go up. If the pair can successfully climb above the resistance at 1.1945, then it will open a chance to contest the next resisance at 1.2349, where turns the pair from bearish to bullish in the near- term and long- term. To the downside, if the pair fails to test 1.1945, then it will potentially head toward 1.1695, which confirms a bearish trend.
Resistance: 1.2349
Support: 1.1945, 1.1695, 1.1492
BTCUSD (Daily Chart)

Bitcoin once again explodes to all time high this week as bitcoin is moving towards the mainstream where major companies, including Square, Paypal, Tesla, and some China giants, are confident in the future. From a technical aspect, bitcoin has overcome the downside pressure from the beginning of the week, and now has turned back to a bullish trend with the psychological support level at 58000. As of now, bitcoin is expected to keep up its bullish momentum as the RSI of 63 has not yet reached the overbought condition while the pair is trading within the ascending channel and above the 50 SMA. The next price target is expected to be the next resistance of 61742.41(Fibonacci 100% retracement.)); if bitcoin can successfully break the level, it will open up a chance to hit another record- high.
Resistance: 61742.41
Support: 58000, 49564.44, 42030.61
Economic Data
|
Currency |
Data |
Time (TP) |
Forecast |
||||
|
AUD |
Retail Sales (MoM) |
08:30 |
N/A |
||||
|
JPY |
BoJ Press Conference |
10:30 |
N/A |
||||
|
RUB |
Interest Rate Decision (Mar) |
18:30 |
4.25% |
||||
|
RUB |
Interest Rate Decision |
18:30 |
N/A |
||||
|
CAD |
Core Retail Sales (MoM) (Jan) |
20:30 |
-2.6% |
||||
-
Global - English

-
United Kingdom - English
-
France - Français

-
Spain - Español

-
Portugal - Português

-
Italy - Italiano

-
Germany - Deutsch

-
Turkey - Türkçe

-
MENA - العربية

-
MENA - English
-
Asia - English
-
India - English

-
Indonesia - Indonesia

-
Japan - 日本語

-
South Korea - 한국어

-
Malaysia - Bahasa Malaysia

-
Malaysia - English
-
Philippines - English

-
Vietnam - Tiếng Việt

-
Thailand - ไทย

-
China - 简体中文

-
China - 繁體中文

This site uses cookies to provide you with a great user experience.
By using vtmarkets.com, you accept
our cookie policy.
Start trading with
VT Markets today


![]()
Follow us on:


![]()


