


Daily market analysis
March 12, 2021
Daily Market Analysis
Market Focus
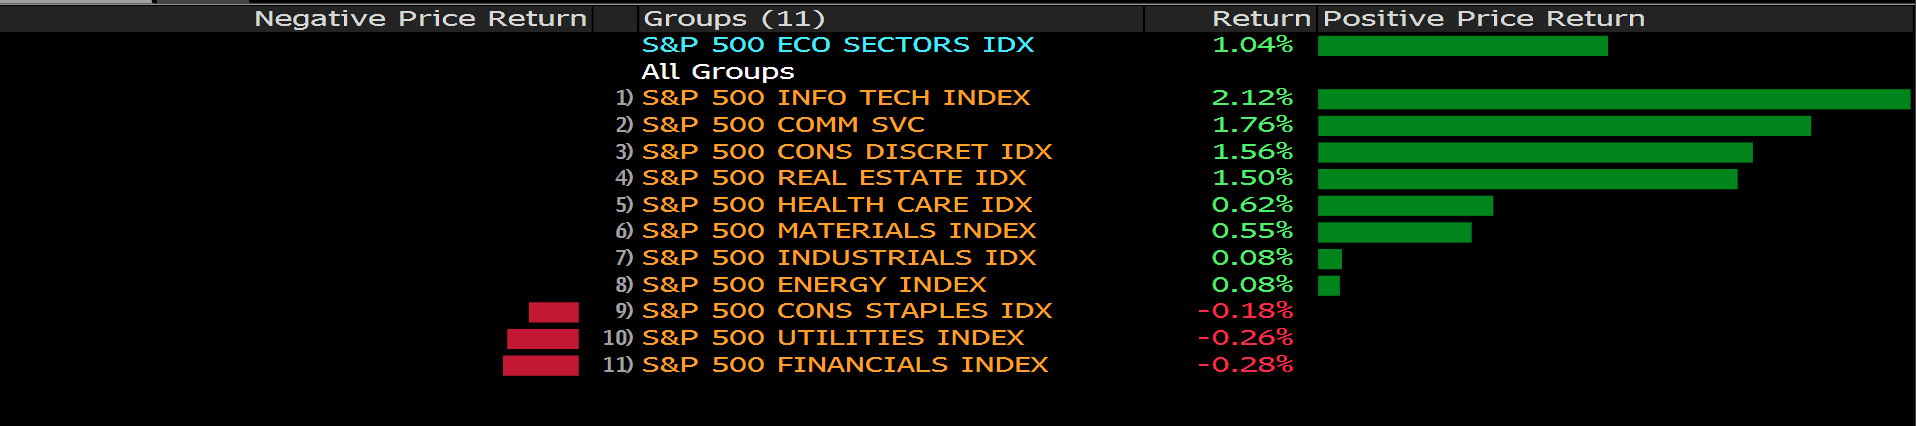
US equity markets jumped to all- time high, fueled by a rally in technology shares as the US yield rates become more stable and the approval of a $1.9 trillion stimulus plan. The 10- year Treasury bond yield that holds steadily eases fears of inflation and rates whilst the upcoming stimulus cheers up the majority of equities; the S&P 500 climbed as much as 1.3% and the Nasdaq jumped more than 2.5%.

The ECB has eventually taken action in response of rising bond yields. The ECB plans to ramp up bond buying to tackle surging rates, and to leave its PEPP unchanged at a total of 1.85 trillion euros, around $2.21 trillion USD. PEPP seems to be disappointed to respond the rising yields, therefore, the Governing Council decides to make purchases at a higher pace over the next three months.
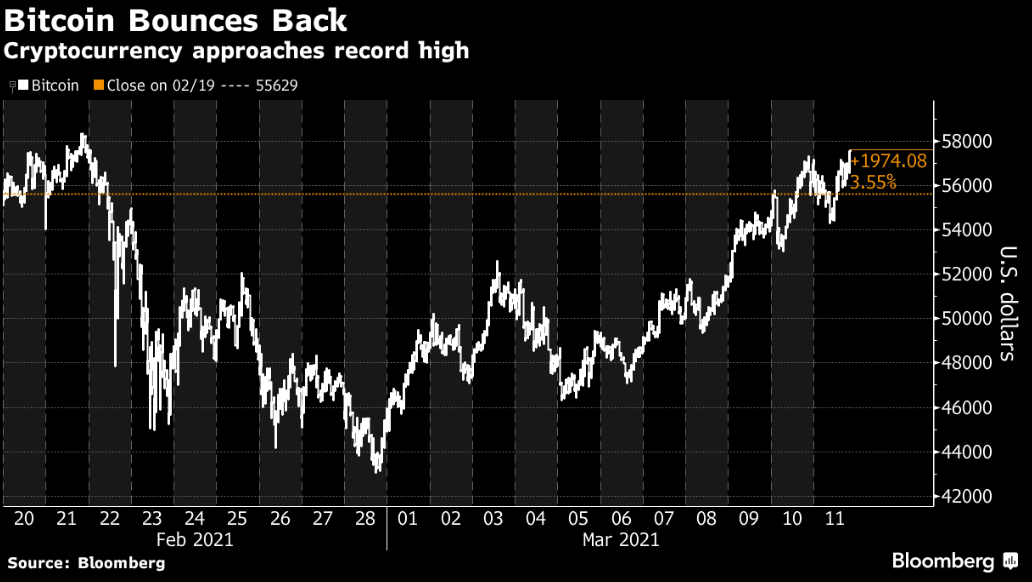
The world’s largest currency, Bitcoin, approaches record high as risk- on rally accelerates. Bitcoin is picking up the bullish momentum again as high as $67680 after dipping more than 20% in the past few weeks. “Bitcoin’s resilience is proving to be the stuff of legend,” said Antoni Trenchev. With increasing institutional interest, Bitcoin gradually shows that it is likely to be a store of value akin to gold that can act as a hedge against inflation and a weaker US dollar.
Market Wrap
Main Pairs Movement
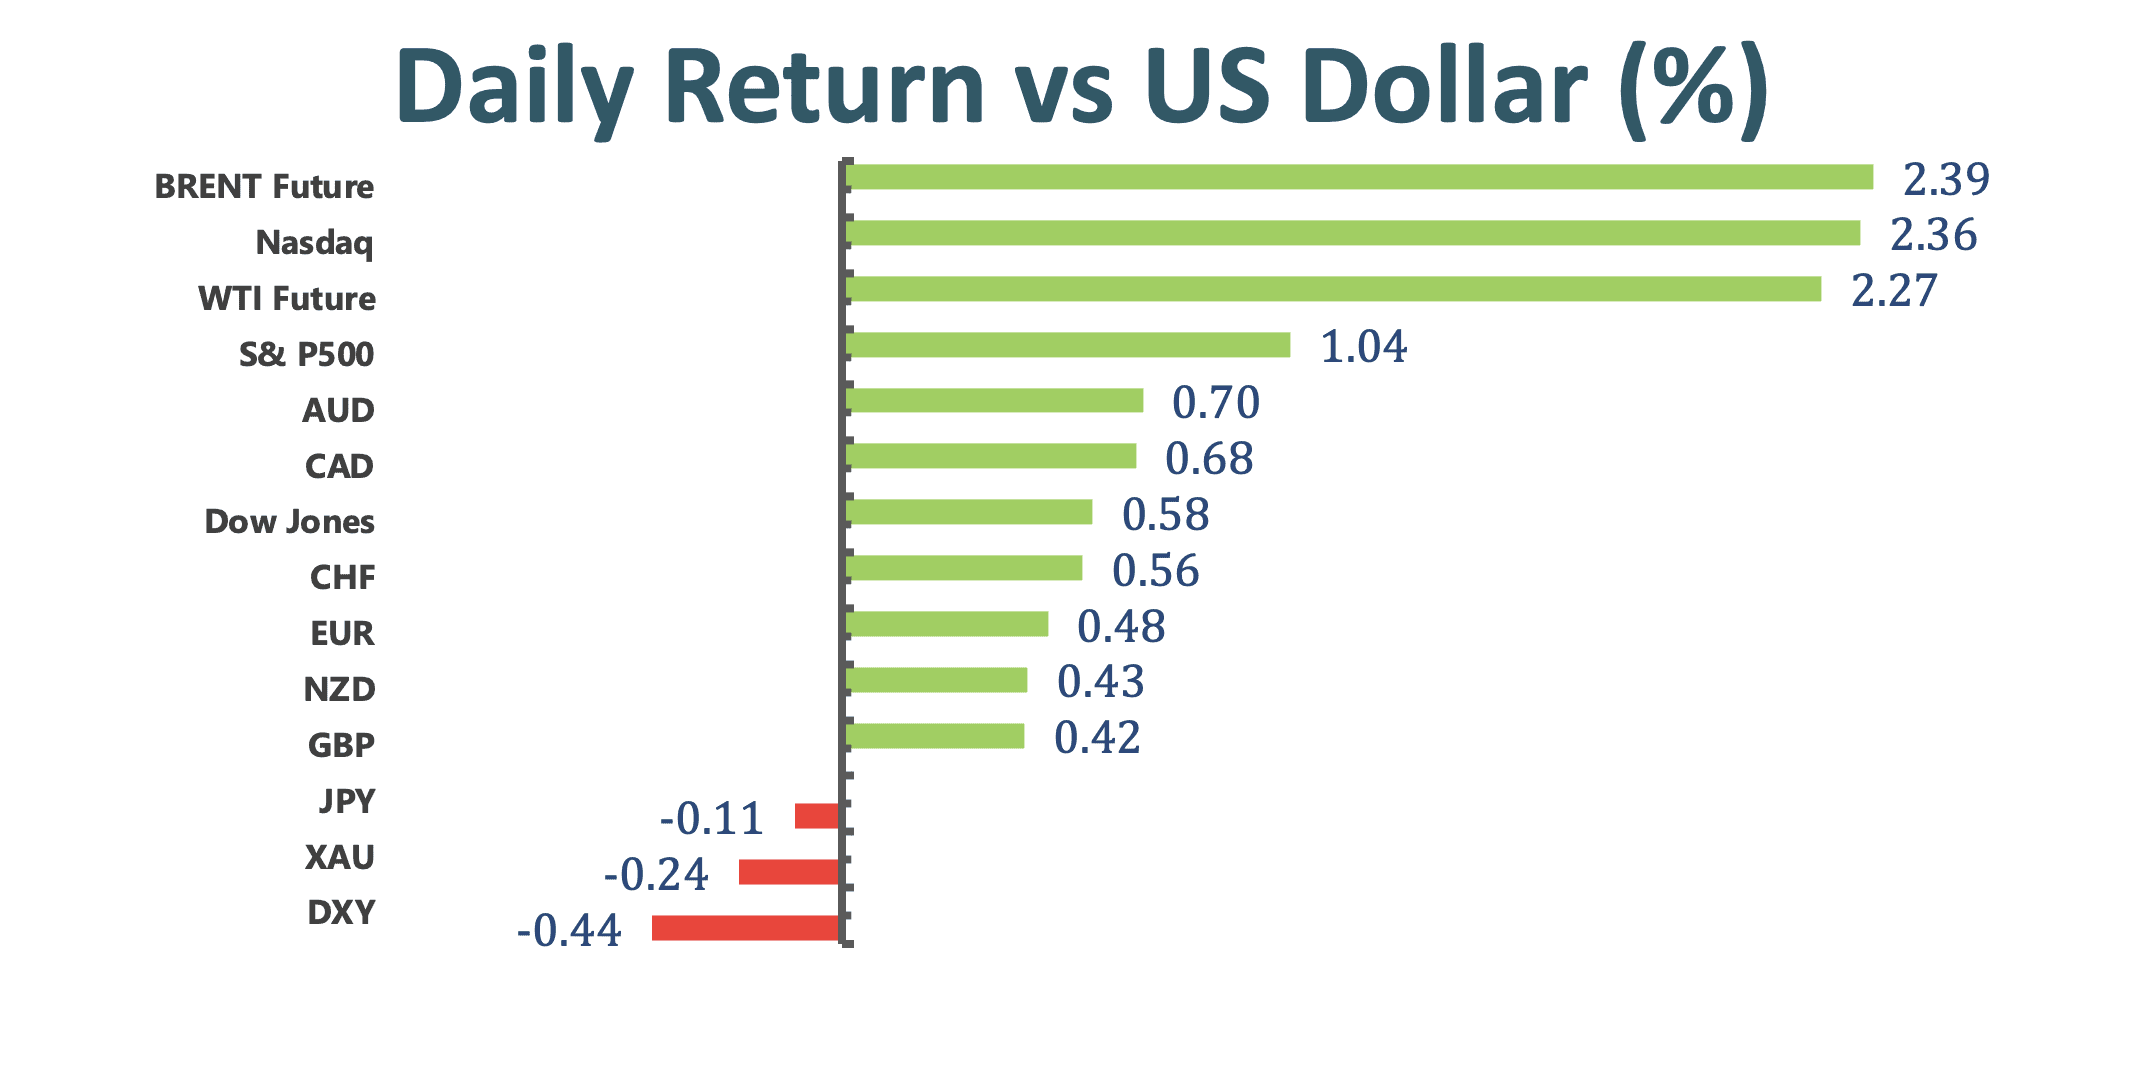
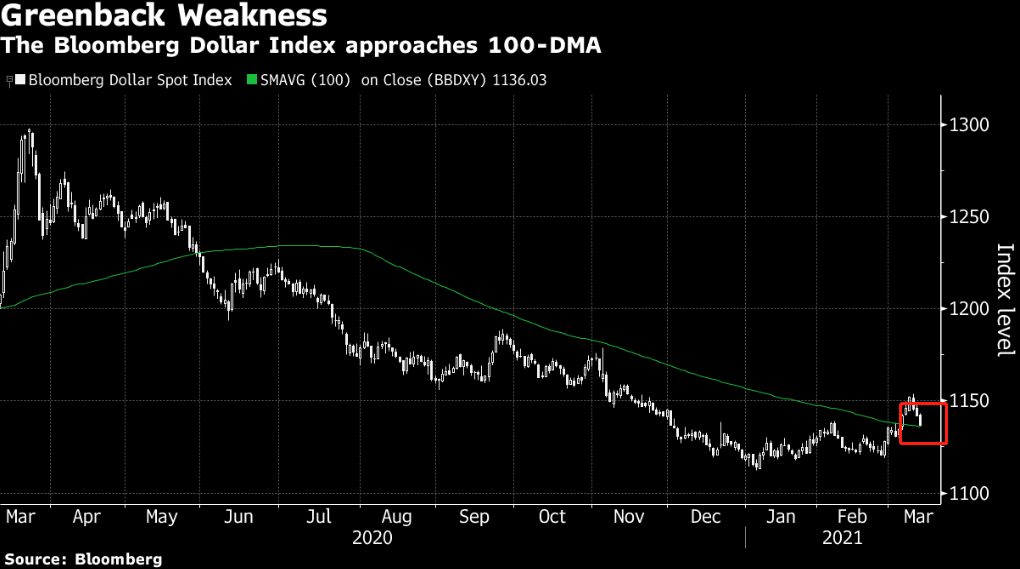
The dollar index extended its losses to one- week low as US equity markets surged and the Treasury bond yield stablized after the 30- year Treasury auction on indications that demand from foreign accounts was soft. The dollar index was down -0.4% to the lowest since last week, trading almost below the 100 EMA.
 The Loonie hit the highest in two weeks, caused by a weak US dollar while investors’ appetite for rsikier assets that boosted commodities, such as oil, copper and gold. In the meanwhile, investors awaits for the speech on household spending from Bank of Canada Deputy Governor.
AUDUSD advanced to a fresh weekly high today, and peaked around 0.7790 amid a weaker US dollar. The Australian dollar is also lifted by a better- than- expected March Consumer Inflation, which is up 4.1%, better than the 3.7%.
Technical Analysis:
XAUUSD (Daily Chart)
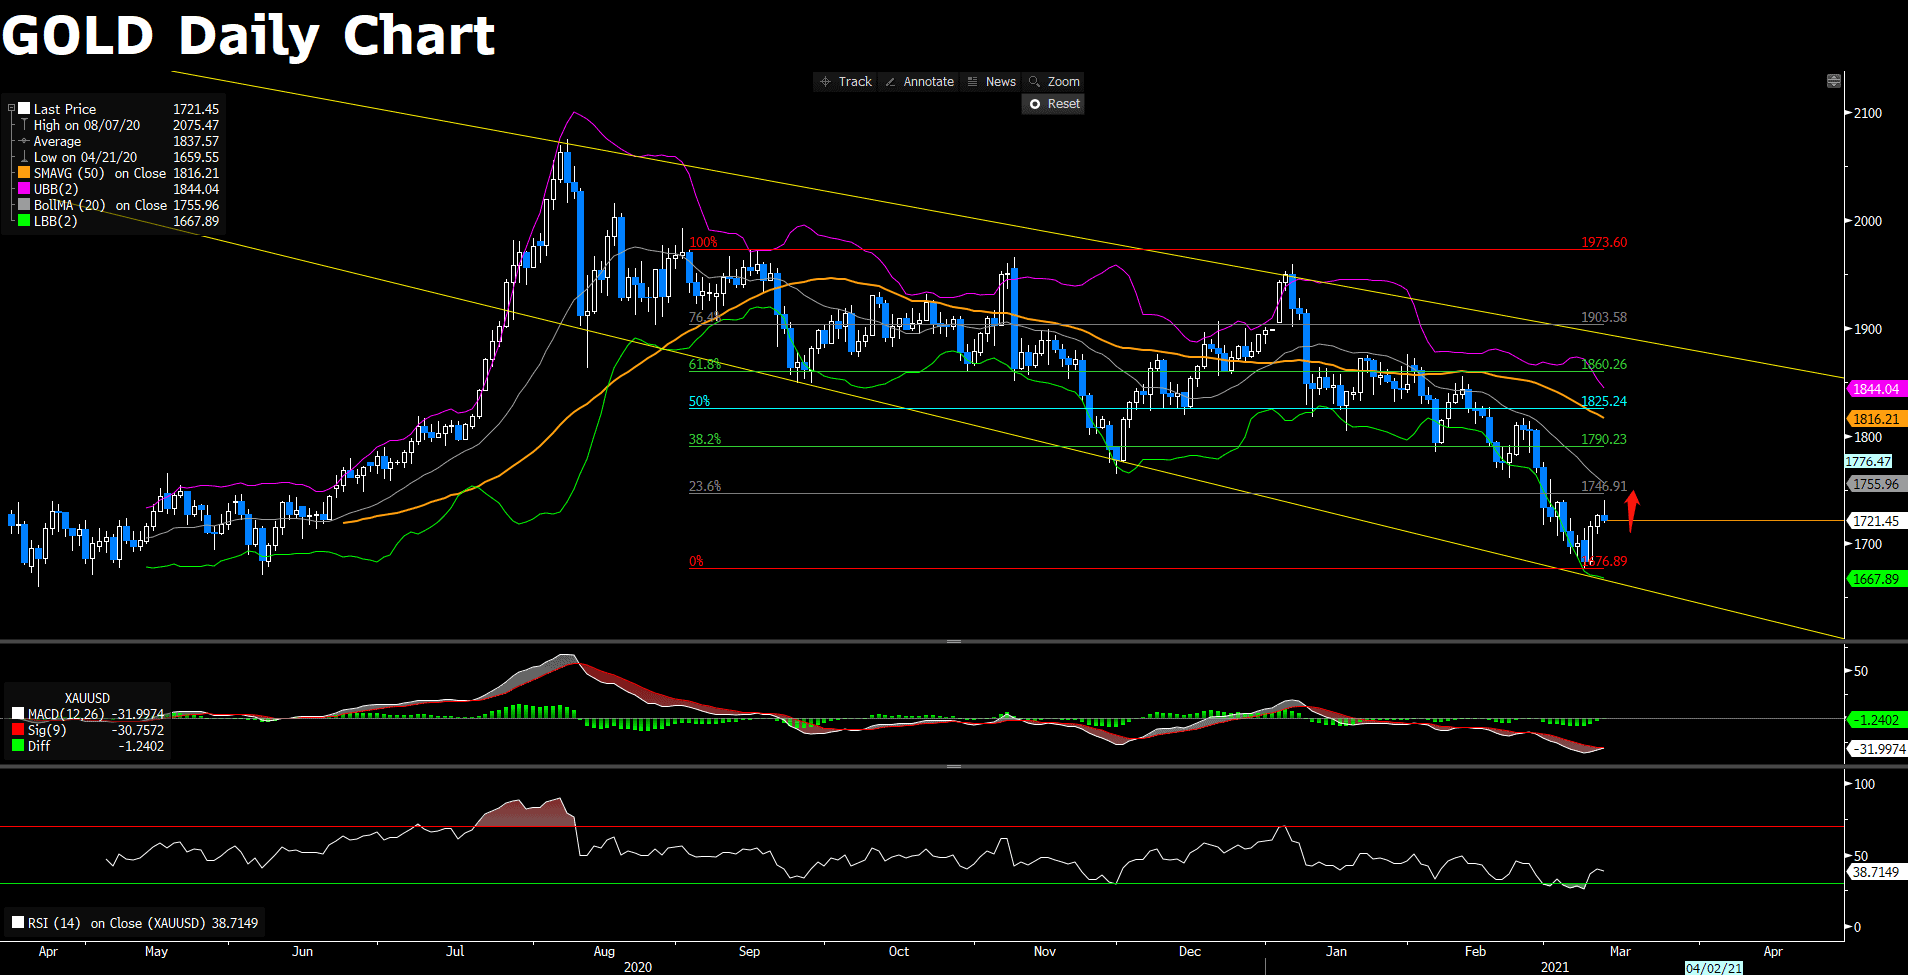
Gold keeps up its positive trend for the third straight trading session, currently trading around 1725 area. On the daily chart, the technical outlook seems to suggest that Gold might extend its recovery toward its resistance level at 1746.91 in the near- term. The RSI indicator stays below 70, implying that there is still more room for the pair on the upside before it confronts a bearish pressure. In the meanwhile, the MACD indicator is on the edge of bearish- to- bullish cross, suggesting that the pair has potential to grow upward. However, in the bigger picture, gold remains bearish as it continues to fall within the descending channel whilist trading below the 50 Simple Moving Average and the midline of Bollinger Band.
Resistance: 1746.91, 1790.23, 1825.24
Support: 1676.89
EURUSD (Daily Chart)
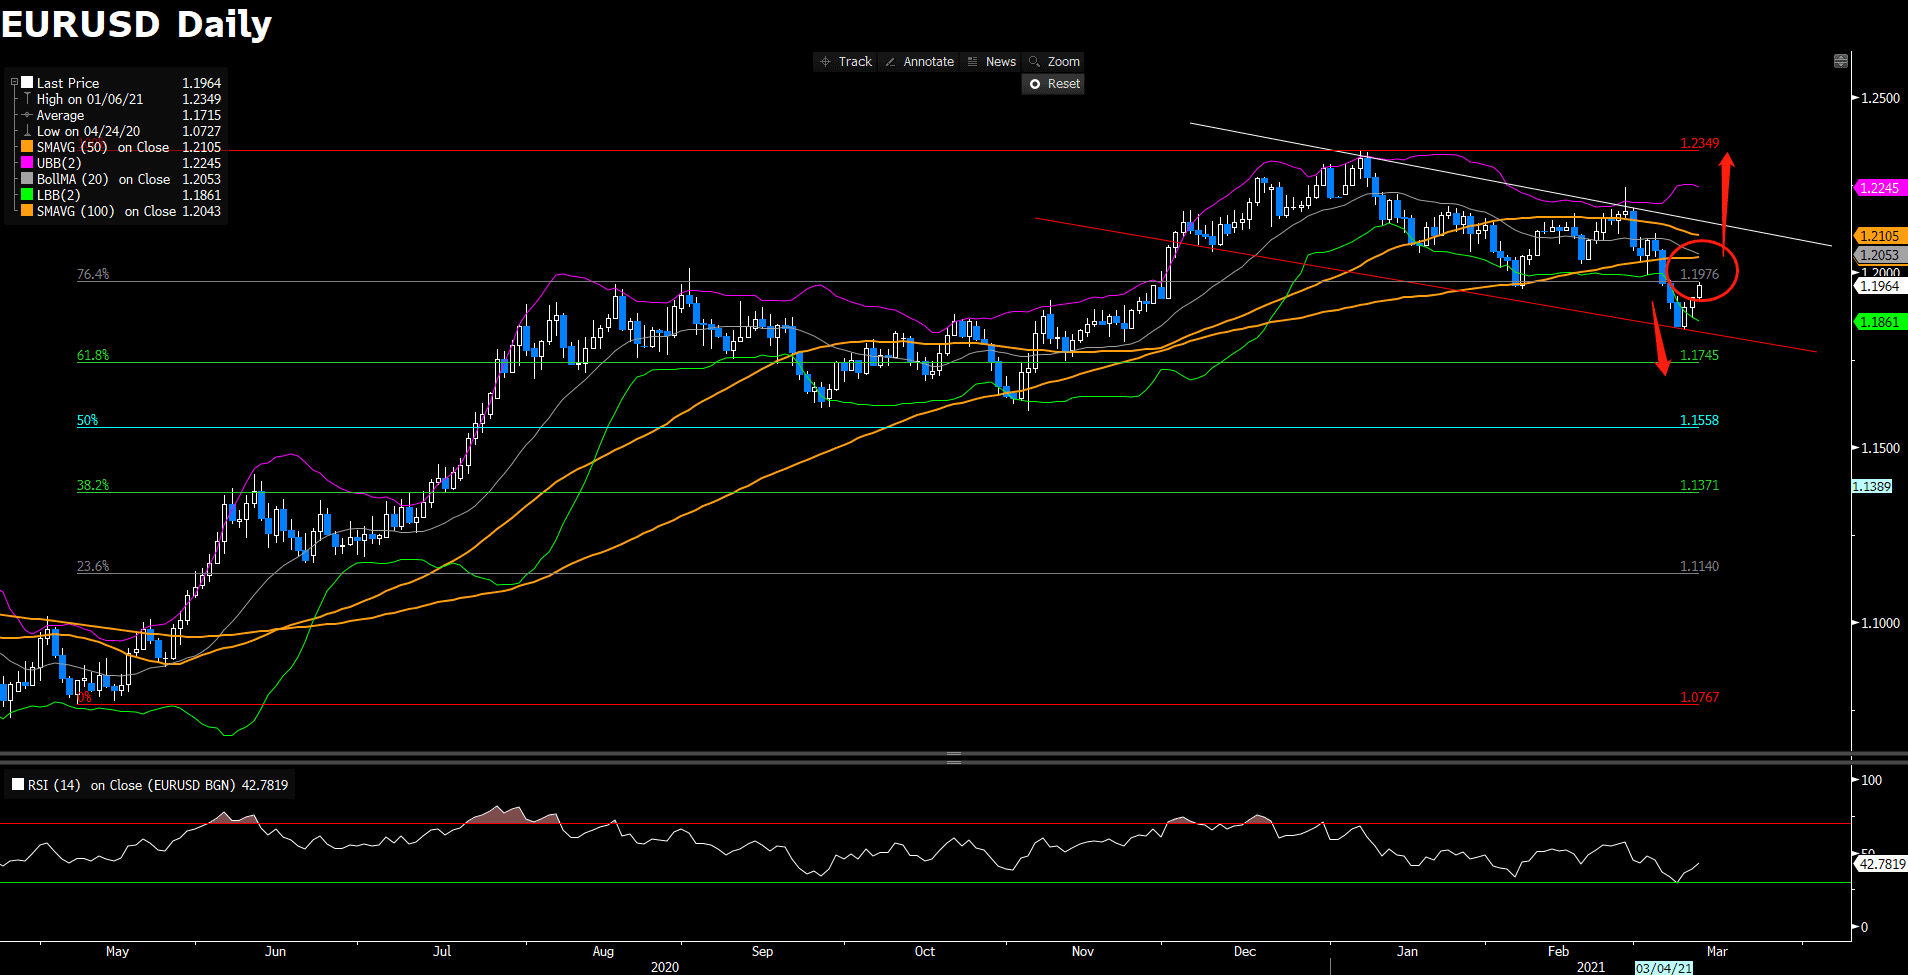
EURUSD extends gain for the second days after the ECB has left the policy rates unchaged and pledged to faster bond- buying. In the near- term, the pair still has a long way to crawl out of the descending trend and trade above the 50 and 100- SMAs, indicating a bearish mode. However, the RSI indicator stays below the overbought condition, below 70, suggesting that there is room for the pair to climb toward the next resistance at 1.2005. If the pair can successfully climb above the resistance, then it will open a chance to contest the next resisance at 1.2349, where turns the pair from bearish to bullish in the near- term and long- term. To the downside, if the pair fails to test 1.2005, then it will potentially head toward 1.1793, which confirms a bearish trend.
Resistance: 1.2005, 1.2349
Support: 1.1793, 1.1621, 1.1449, 1.1237
GBPUSD (Four- Hour Chart)
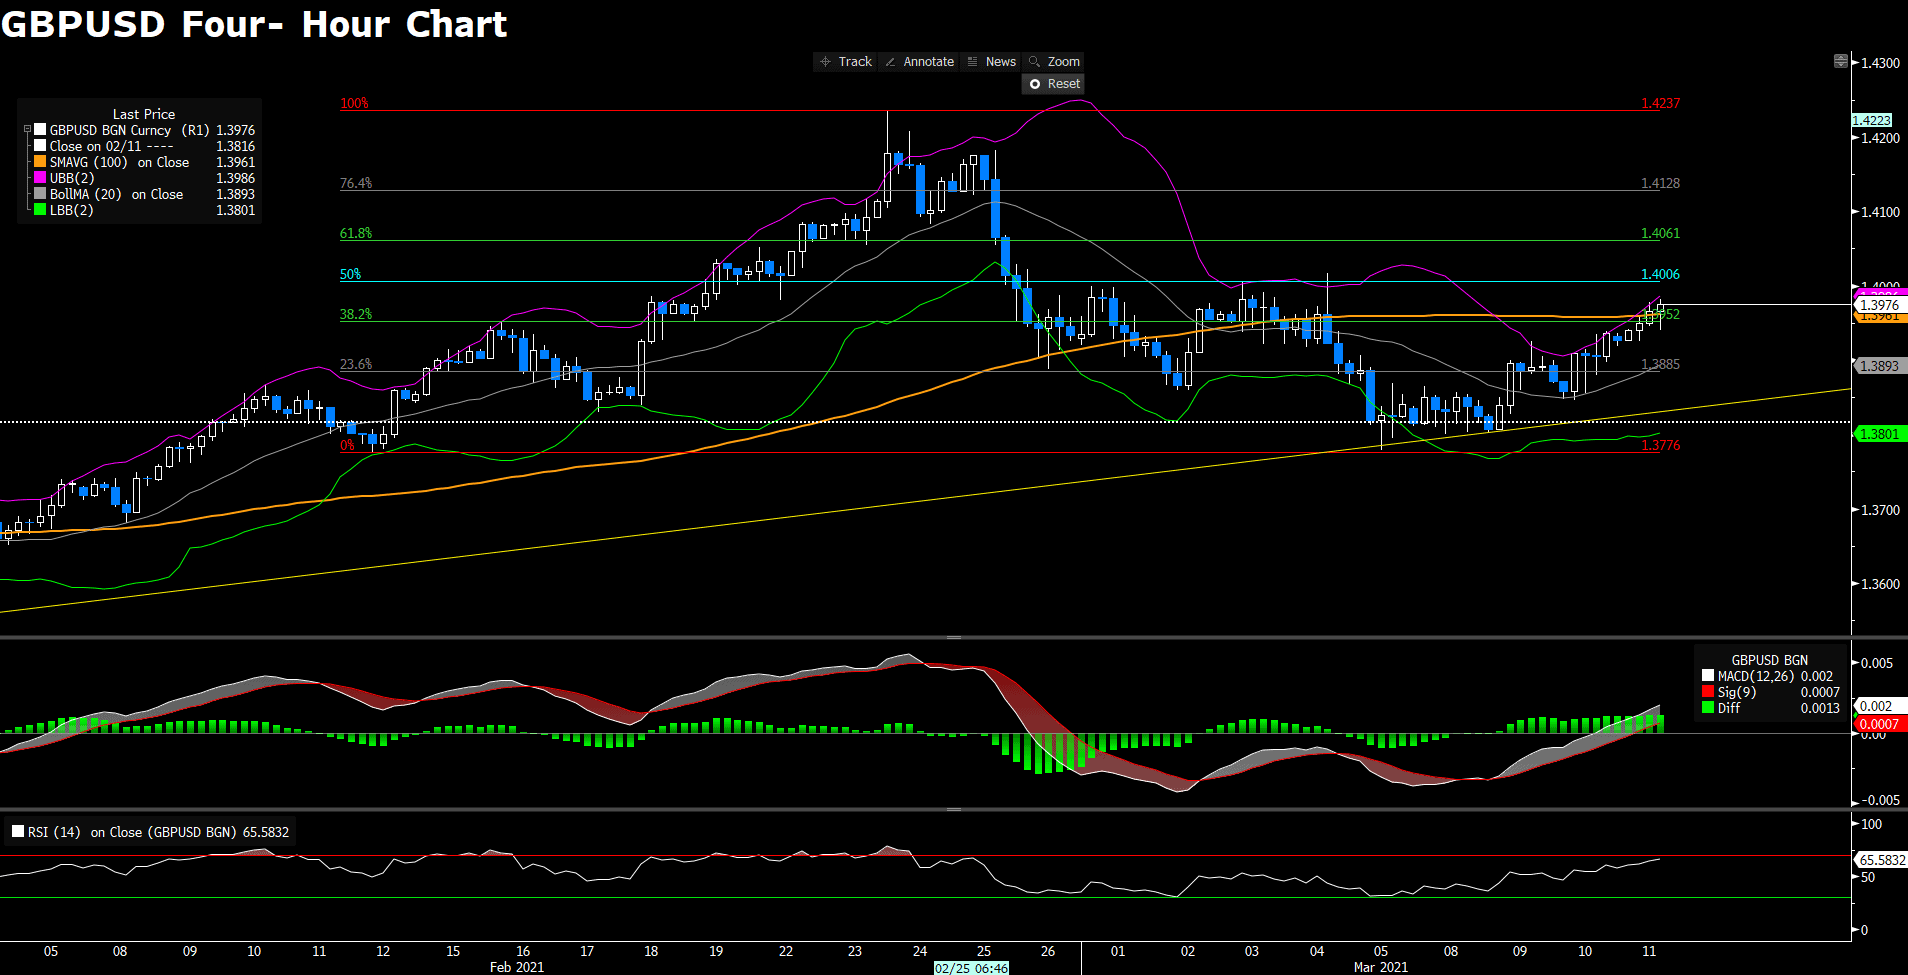
GBPUSD continues to advance beyond 1.3950 as the US dollar falls whilist a falling yield rates and the approval of the stimulus package. From a technical perspective, GBPUSD has surpassed the 100- SMA on the four- hour chart, which gives the pair more confirmation to a positive movement. In the meantime, the technical indicators are in support of the pair’s bulls as the RSI indicator has not yet reached the overbought condition, below 70, and the MACD well converge to the positive territory. All in all, bulls are in the lead, and the pair is heading toward the next resistance level at 1.4006.
Resistance: 1.4006, 1.4061, 1.4128
Support: 1.3952, 1.3885, 1.3776
Economic Data
|
Currency |
Data |
Time (TP) |
Forecast |
||||
|
GBP |
GDP (YoY) |
15:00 |
N/A |
||||
|
GBP |
GDP (QoQ) |
15:00 |
N/A |
||||
|
GBP |
GDP (MoM) |
15:00 |
N/A |
||||
|
GBP |
Manufacturing Production (MoM) (Jan) |
15:00 |
-0.8% |
||||
|
GBP |
Monthly GDP 3M/3M Change |
15:00 |
N/A |
||||
|
USD |
PPI (MoM) (Feb) |
21:30 |
0.5% |
||||
|
CAD |
Employment Change (Feb) |
21:30 |
75k |
||||
-
Global - English

-
United Kingdom - English
-
France - Français

-
Spain - Español

-
Portugal - Português

-
Italy - Italiano

-
Germany - Deutsch

-
Turkey - Türkçe

-
MENA - العربية

-
MENA - English
-
Asia - English
-
India - English

-
Indonesia - Indonesia

-
Japan - 日本語

-
South Korea - 한국어

-
Malaysia - Bahasa Malaysia

-
Malaysia - English
-
Philippines - English

-
Vietnam - Tiếng Việt

-
Thailand - ไทย

-
China - 简体中文

-
China - 繁體中文

This site uses cookies to provide you with a great user experience.
By using vtmarkets.com, you accept
our cookie policy.
Start trading with
VT Markets today


![]()
Follow us on:


![]()


