


Daily market analysis
February 25, 2021
Daily Market Analysis
Market Focus
US equities reversed losses and staged a rally as Federal Reserve Chairman Jerome Powell reaffirmed his view that the economy needs support. Government bond yields climbed along with oil prices.
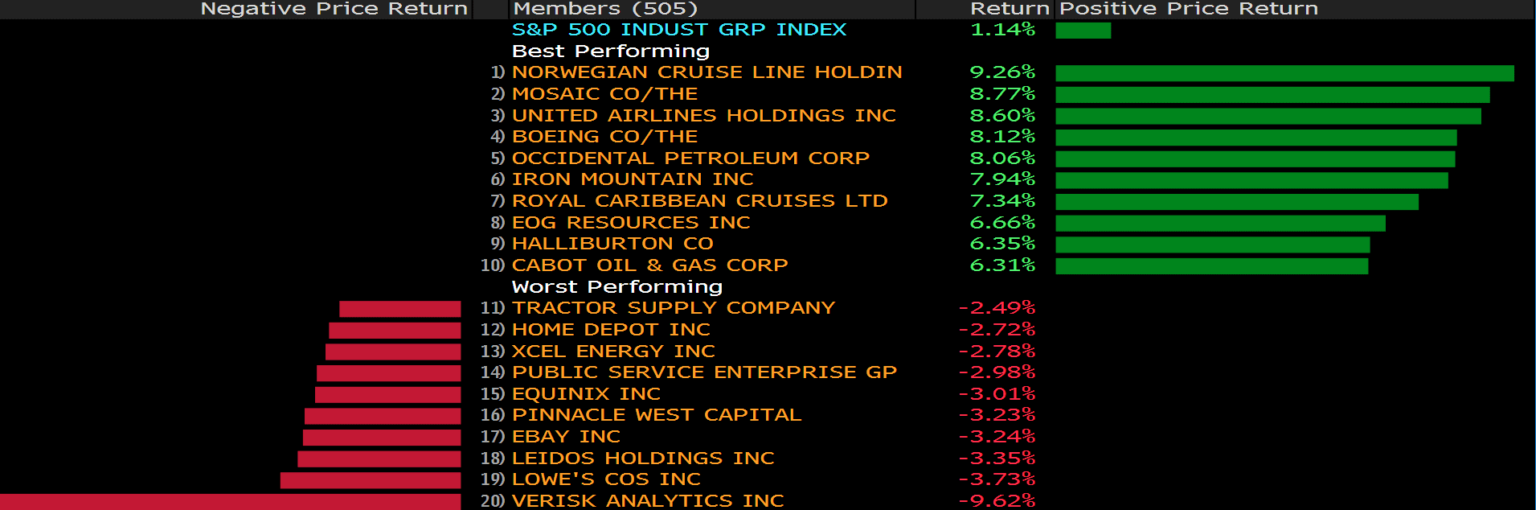
Energy and industrial companies led gains in the S&P 500 Index, offsetting weakness for tech stocks. Banks advanced, sending an industry gauge to its highest since 2007, and small caps rallied more than 2% after U.S. regulators said Johnson & Johnson’s Covid 19 vaccine is safe and effective. Tesla Inc. gained after Ark investment Management’s Cathie Wood said she bought shares during this week’s selloff. US 10-year yields touched 1.43%, the highest since Feb 2020, before paring the increase.
Fed Chair Powell testified before lawmakers, saying the U.S. economy still had a long way to go to reach maximum employment and the Fed’s targeted inflation, a signal he wants to remain accommodative. Equity investors are weighing predictions for a post-pandemic surge in economic activity and corporate earnings with concerns that higher interest rates could dent the appeal of stocks.
While Europe Stoxx 600 climbed, the Asian stocks tumbled as Hong Kong officials announced its first stamp-duty increase on stock trades since 1993.
Market Wrap
Main Pairs Movement
US Treasury yields are back up, flirting with one-year highs and backing dollar’s gains. EURUSD trades was seen near daily lows in the 1.2130s area before Powell’s testimony and bounced back above 1.2160s afterward.
The Australian dollar is up against its American rival, trading above 0.7960 price zone. Substantial gains in Wall Street underpin the commodity-linked currency.
The loonie remained depressed through the early European session and was last seen in 1.2510s, breaking below the 34-month lows set earlier this Wednesday.
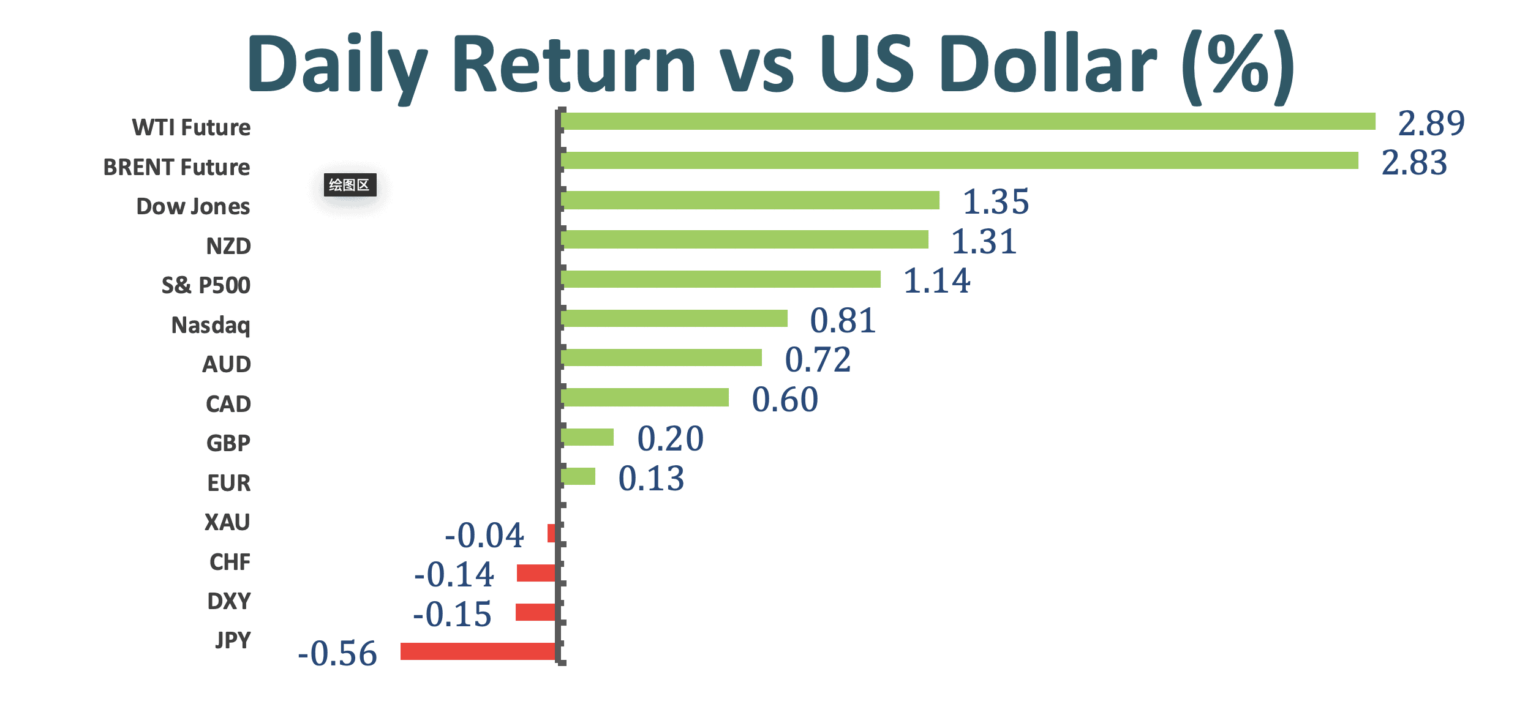
DXY keeps the rangebound trading in the 90.00 region. Front-month futures contracts for the WTI continues to advance to the upside on Wednesday and briefly even managed to rally above the $63.00 level for the first time since Jan 2020.
Technical Analysis:
USDJPY (Four-hour Chart)
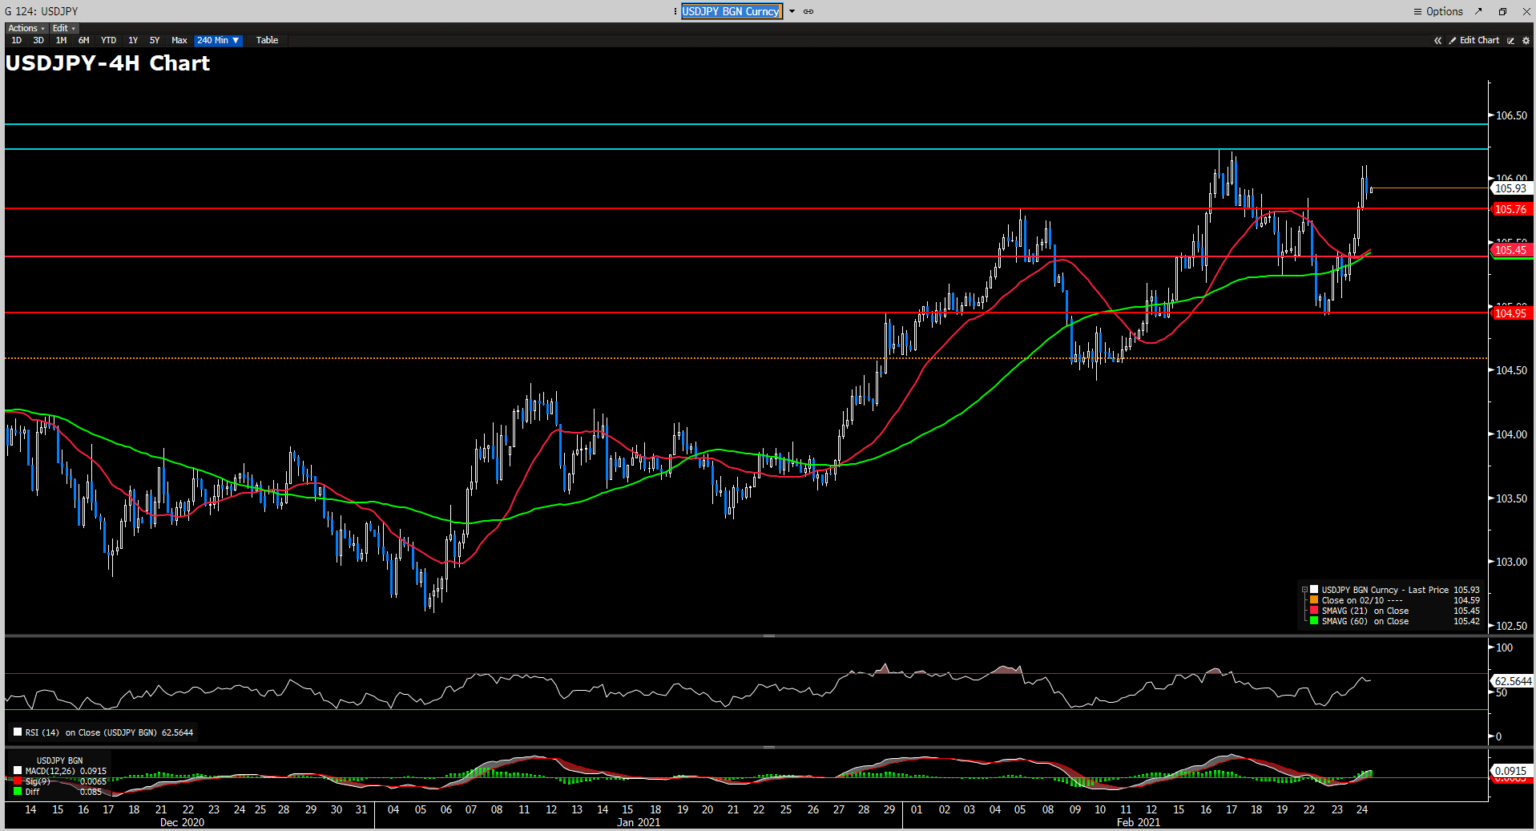
After a weak start for the week, USDJPY regained strong positive traction and posted its second consecutive wins today. A recovery in the investors sentiment across US equity markets undermines the safe-have JPY and the greenback reclaimed some momentum after the US yields peaked at 1.429%. From a technical perspective, a recent golden cross between the pair’s 21-Day and 60-Day SMAVG indicates a bullish momentum has formed. The MACD histogram also supports the bulls. However, as the RSI approaches mid-60s, the bulls might not have much room to advance further before a downward correction kicks in to adjust the price action. If USDJPY can find acceptance above the 106 price level, it can certainly open the doors for more gains. However, if the ongoing trend is reversed, we can expect to see USDJPY to rest near 105.76 before dipping down towards 105.45, then104.95.
Resistance: 106.23, 106.43
Support: 105.76, 105.45, 104.95
GBPUSD (Four-hour Chart)
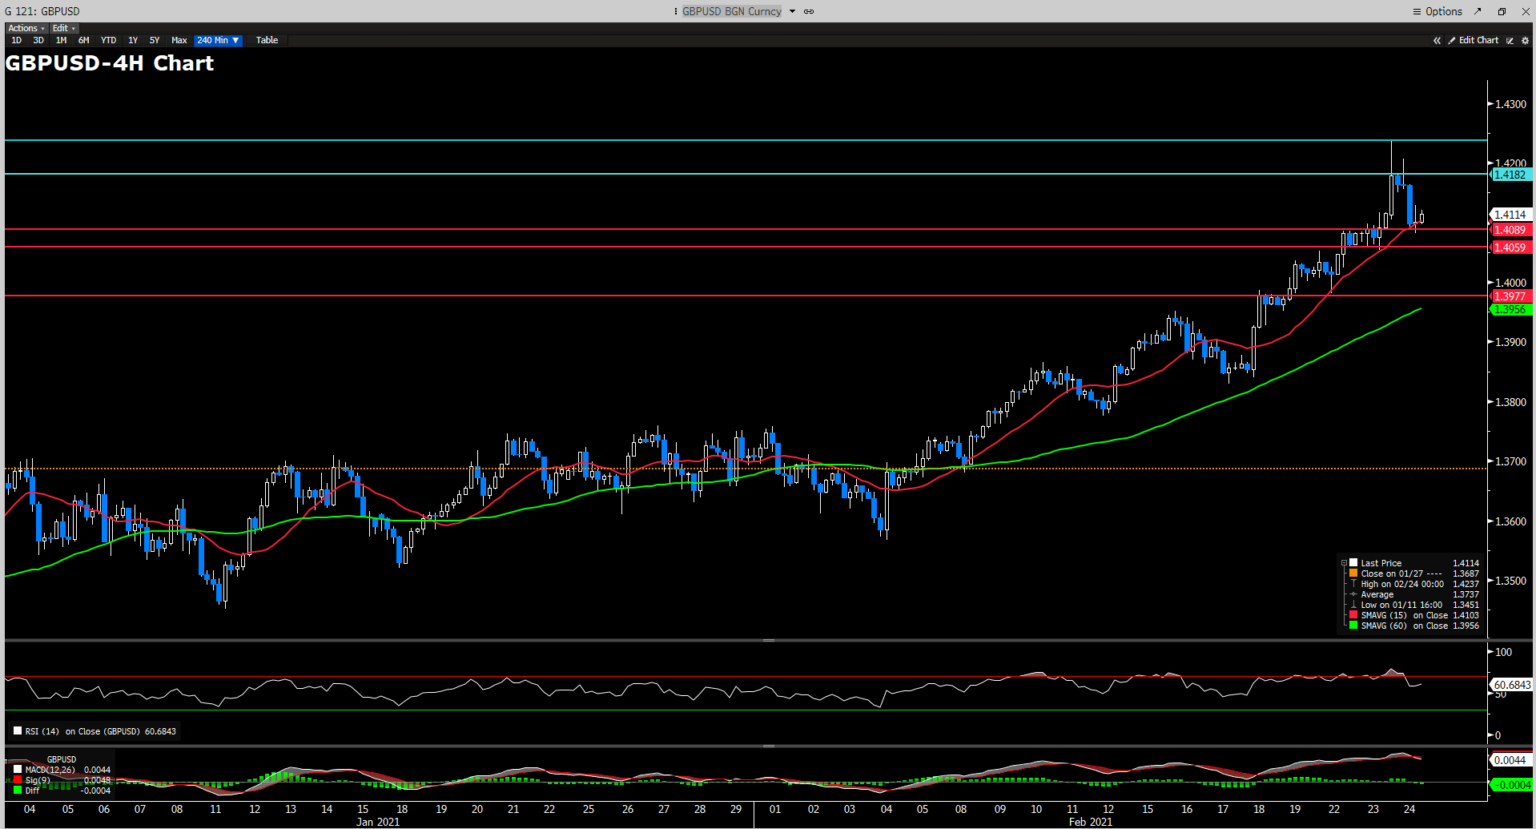
Fail to extend further above the 1.4237 resistance, the Cable retreated modestly below the 1.41 level. A combination of the BoE pushing back on the need for negative rates and the Covid-19 vaccine rollouts attract investment back to sterling. Technically speaking, the Cable is still on the upside as both 15-Day SMAVG and MACD histogram suggested. The ongoing retreat is largely due to a rising demand for the greenback on the day. If all things remained the same, the sterling still has the upper hand of being one of the first countries to reopen its economy. Thus, a consolidation above the 1.42 will enhance the investors’ confidence in longing the pair. Nevertheless, upcoming UK politics and Brexit related issues still pose some threats to the sustainability of the UK economy. In all, investors can expect a bullish Cable in the short- to mid-term, but looking ahead, uncertainty surrounding the UK politics require investors to stay cautious on potential deterioration of the sterling’s outlook.
Resistance: 1.4182, 1.4237
Support: 1.4089, 1.4059, 1.3977
XAUUSD (Four-hour Chart)
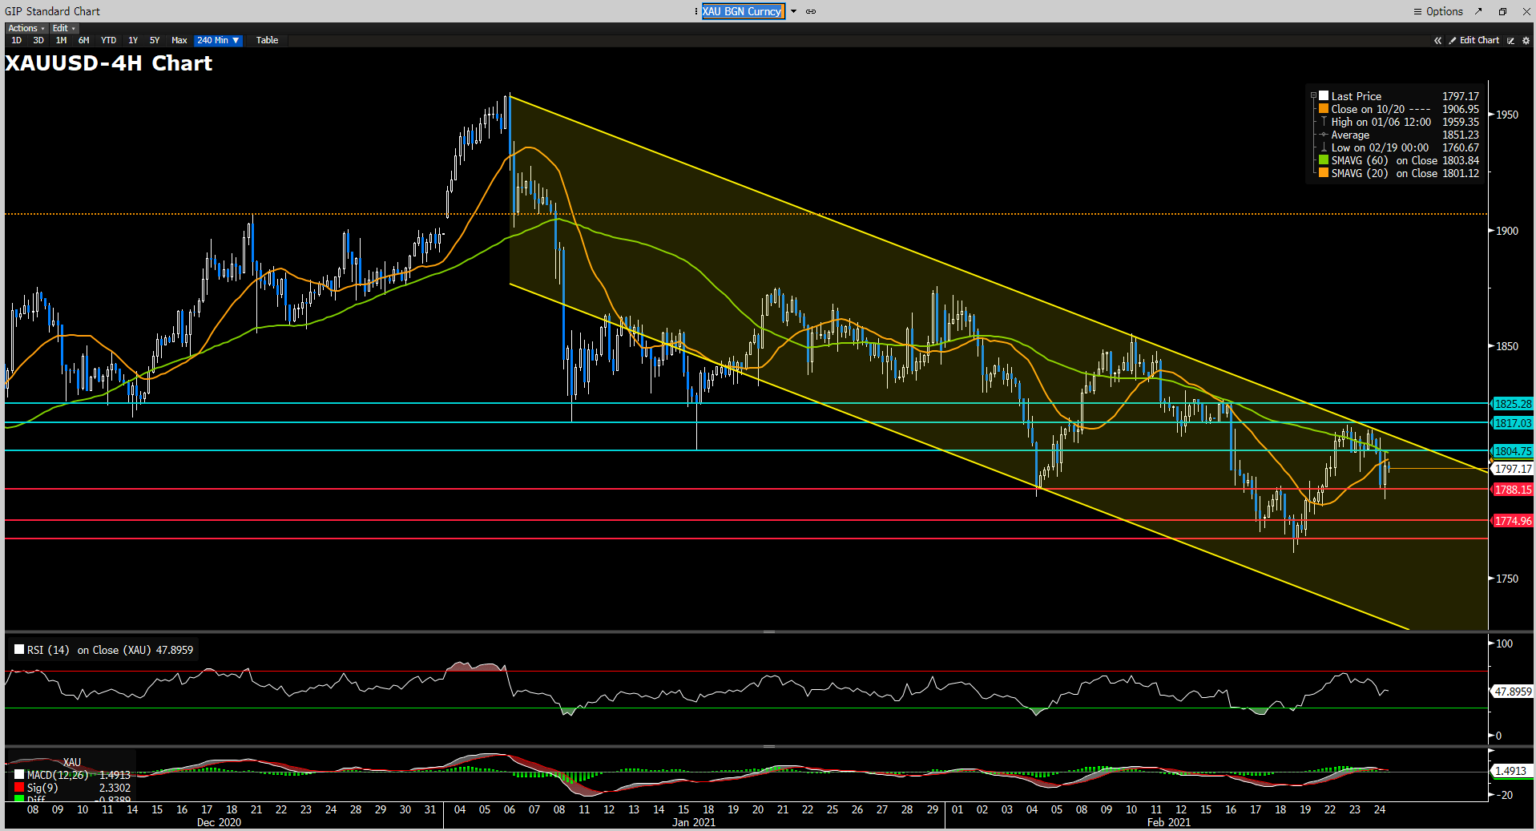
Although the Gold has made quite a few attempts to break above resistance levels at $1817, $1855, and $1875, the overall trend for the precious metal seems to be confined substantially on the back foot since the pair topped around $1960 in early Jan. The overall improved risk-on sentiment and the ongoing rising US 10-year Yields both crushed the XAUUSD bulls’ hopes to reclaim $1900. From a technical perspective, the 60-Day SMAVG supports the bearish momentum. The 48ish RSI indicate that investors are undecisive at the moment. If XAUUSD can find acceptance above $1804, the precious metal can be trapped between $1804 and $1817. On the flip side, a price action that dragged XAUUSD below $1800 can leave the market under pressure. The XAUUSD bears are eyeing $1767 if the yellow metal bulls failed to keep the pair above $1788.
Resistance: 1804, 1817, 1825
Support: 1788, 1774, 1767
Economic Data
|
Currency |
Data |
Time (TP) |
Forecast |
||||
|
USD |
Core Durable Goods Orders |
21.30 |
0.7% |
||||
|
USD |
GDP (QoQ) (Q4) |
21.30 |
4.2% |
||||
|
USD |
Initial Jobless Claims |
21.30 |
838K |
||||
|
USD |
Pending Home Sales (MoM) (Jan) |
23.00 |
-0.2% |
||||
-
Global - English

-
United Kingdom - English
-
France - Français

-
Spain - Español

-
Portugal - Português

-
Italy - Italiano

-
Germany - Deutsch

-
Turkey - Türkçe

-
MENA - العربية

-
MENA - English
-
Asia - English
-
India - English

-
Indonesia - Indonesia

-
Japan - 日本語

-
South Korea - 한국어

-
Malaysia - Bahasa Malaysia

-
Malaysia - English
-
Philippines - English

-
Vietnam - Tiếng Việt

-
Thailand - ไทย

-
China - 简体中文

-
China - 繁體中文

This site uses cookies to provide you with a great user experience.
By using vtmarkets.com, you accept
our cookie policy.
Start trading with
VT Markets today


![]()
Follow us on:


![]()


