


Daily market analysis
February 23, 2021
Daily Market Analysis
Market Focus
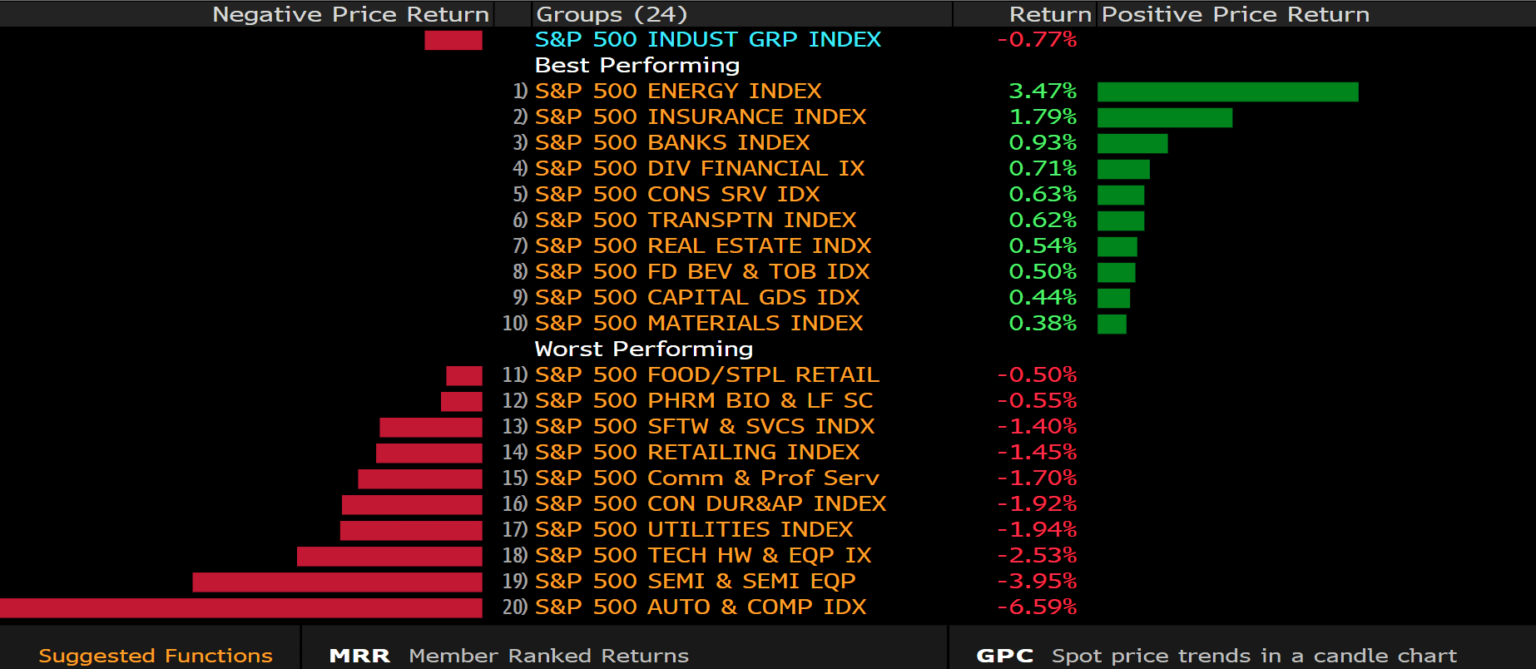
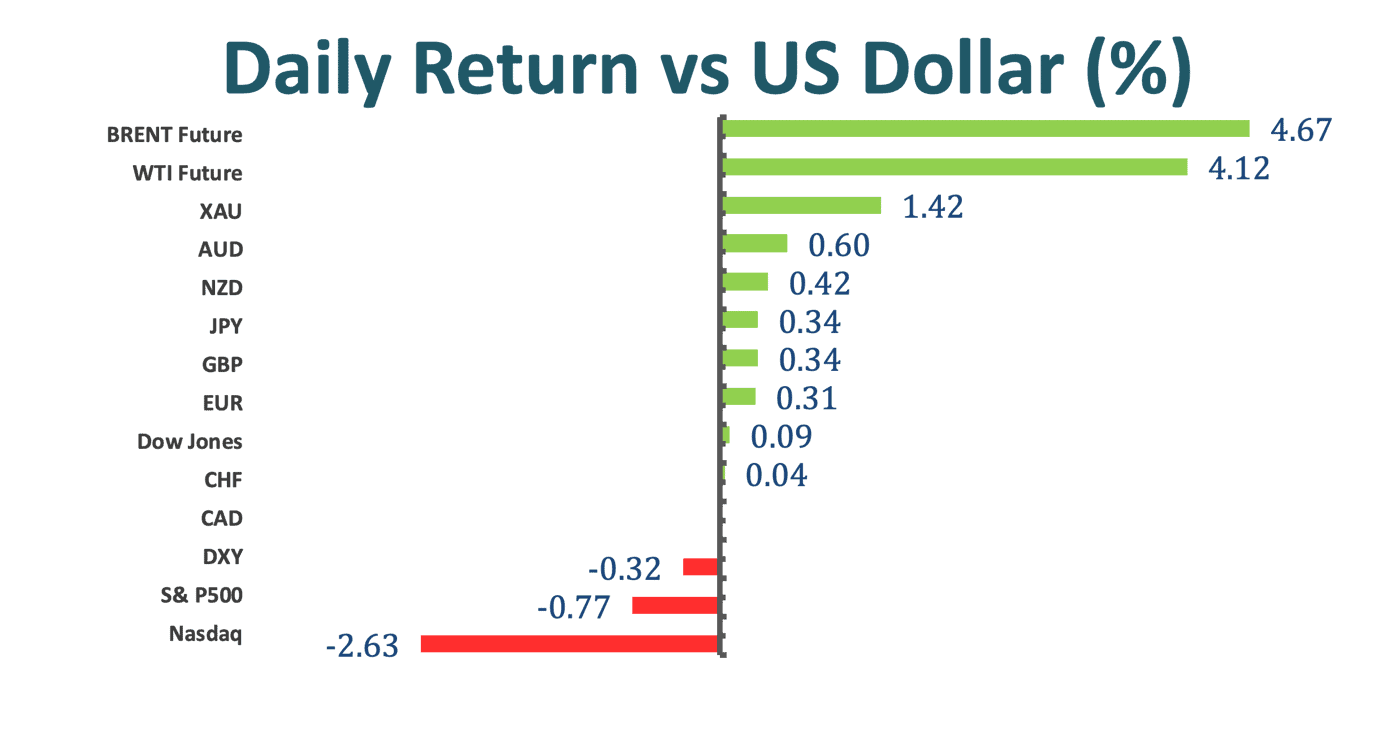
Tech stocks dropped on valuation concerns while commodities rallied, and bond yields rose with investors pricing in stronger growth and faster inflation as the global economy recovers. The Nasdaq 100 tumbled more than 2.5% to a three-week low as investors questioned the appeal of expensive, growth-focused stocks. The S&P 500 Index fell for a fifth day, its longest losing streak in a year. Gains for energy shares and financial companies limited losses on the Dow Jones Industrial Average. European and Asian markets were broadly negative.
Commodities were almost uniformly green. Brent oil climbed above $65 a barrel as Goldman Sachs Group Inc. predicted prices could advance into the $70s in coming months. Copper briefly rose above $9,000 a metric ton for the first time in nine years, taking another step closer to an all-time high set in 2011 as investors bet that supply tightness will increase as the world recovers from the pandemic.
After a tremendous run from the depths of the pandemic selloff 11 months ago, stocks are under scrutiny as an increase an interest rates bolsters the appeal of fixed-income investments.
According to Scott Knapp, a chief market strategist of CUNA Mutual Group, “Long-duration assets are the ones that are most vulnerable in a rising interest rate environment. The exact same stocks that led the market higher when interest rates were plummeting are the ones most vulnerable when interest rates rise.”
Treasury yields climbed and a key part of the curve – the gap between 5- and 30-year yields – touched the highest level in more than five years.
Market Wrap
Main Pairs Movement
The EURUSD pair trades just below the 1.2170/80 resistance area, lacking momentum despite the broad dollar’s weakness. Risk is skewed to the upside. The Aussie pair trades around 0.7920, as a better market mood and firmer commodity prices, underpin AUDUSD. US Treasury yields keep setting the market’s tone. The Loonie pair rose to 1.2650 during the early American session but lost its traction with the rising crude oil prices providing a boost to the commodity-sensitive CAD.
With decreasing US yields, DXY turned south and is approaching 90.00. Crude Oil prices regain the smile at the beginning of the week and push the barrel of WTI back above the key barrier at $60.00. The uptick in crude oil prices comes amidst the persistent weakness hitting the dollar, while activity in Texas is expected to gradually return to normality following the recent extreme freezing weather conditions.
Technical Analysis:
USDJPY (Four-hour Chart)

After failing to find acceptance above the 105.88 resistance level earlier today, the USDJPY gradually tumbled near 105 in the following sessions. At the moment, the USDJPY is teasing the 105 support level at 105.04. Please note that the price range USDJPY is trading at currently is also the lowest seen in a week. A declined in the US yields weakened the greenback, but no rebound has been formed as the DXY continued to dive lower, sitting around 90.009 (the lowest in a month). From a technical perspective, the USDJPY is still on a bullish trend as indicated by the 21-Day SMAVG. Therefore, it is inferable that the plummet of USDJPY is mainly constructed by the fundamental outlook of the lowered US yields circulating the markets. In other words, the fundamental outweigh the technical. Given that the RSI is nearing the oversold threshold, a positive correction can be expected.
Resistance: 105.40, 105.88
Support: 105, 104.79, 104.53
GBPUSD (Four-hour Chart)
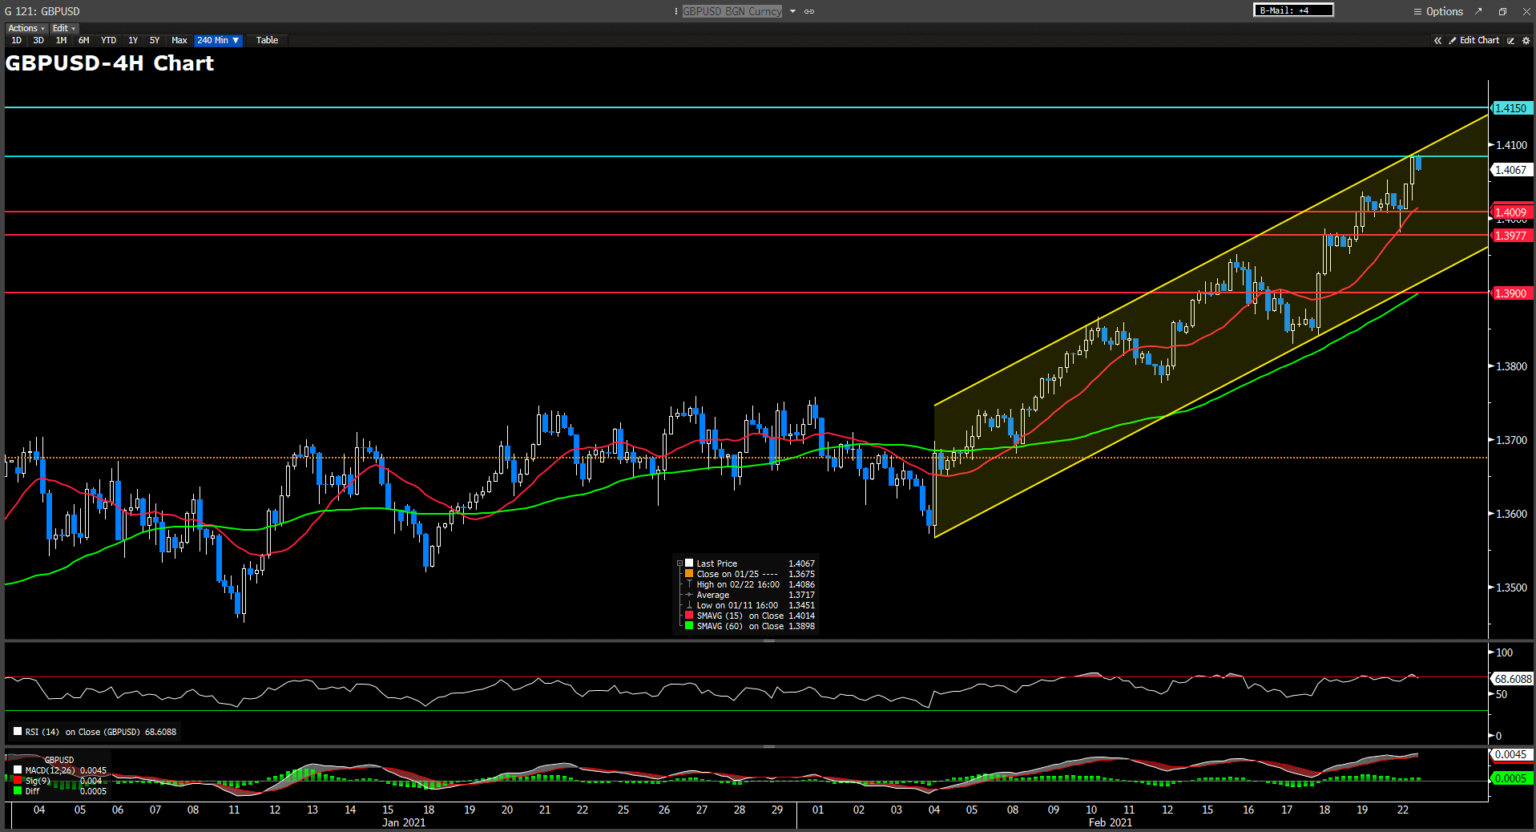
The Cable pair extended to a multi-year high after UK PM Boris Johnson announced his plan to ease UK’s lockdown in a four-step procedure. On top of that, a broad-based greenback weakness also helps fuel the surge of Cable. At the moment, we can see that the Cable has been confined in an uptrend channel since the beginning of Feb and some higher highs are suggesting the bullish GBPUSD is well-supported. Additionally, from a technical perspective, both 15-Day SMAVG and MACD histogram indicate that the Cable remains on a bullish momentum. However, as the RSI for the pair is almost hitting the 70 line, a downward correction is likely. On the side note, if GBPUSD can penetrate the 1.4085 resistance, the following resistance would be 1.4150.
Resistance: 1.4085, 1.4150
Support: 1.4009, 1.3977, 1.3900
XAUUSD (Four-hour Chart)
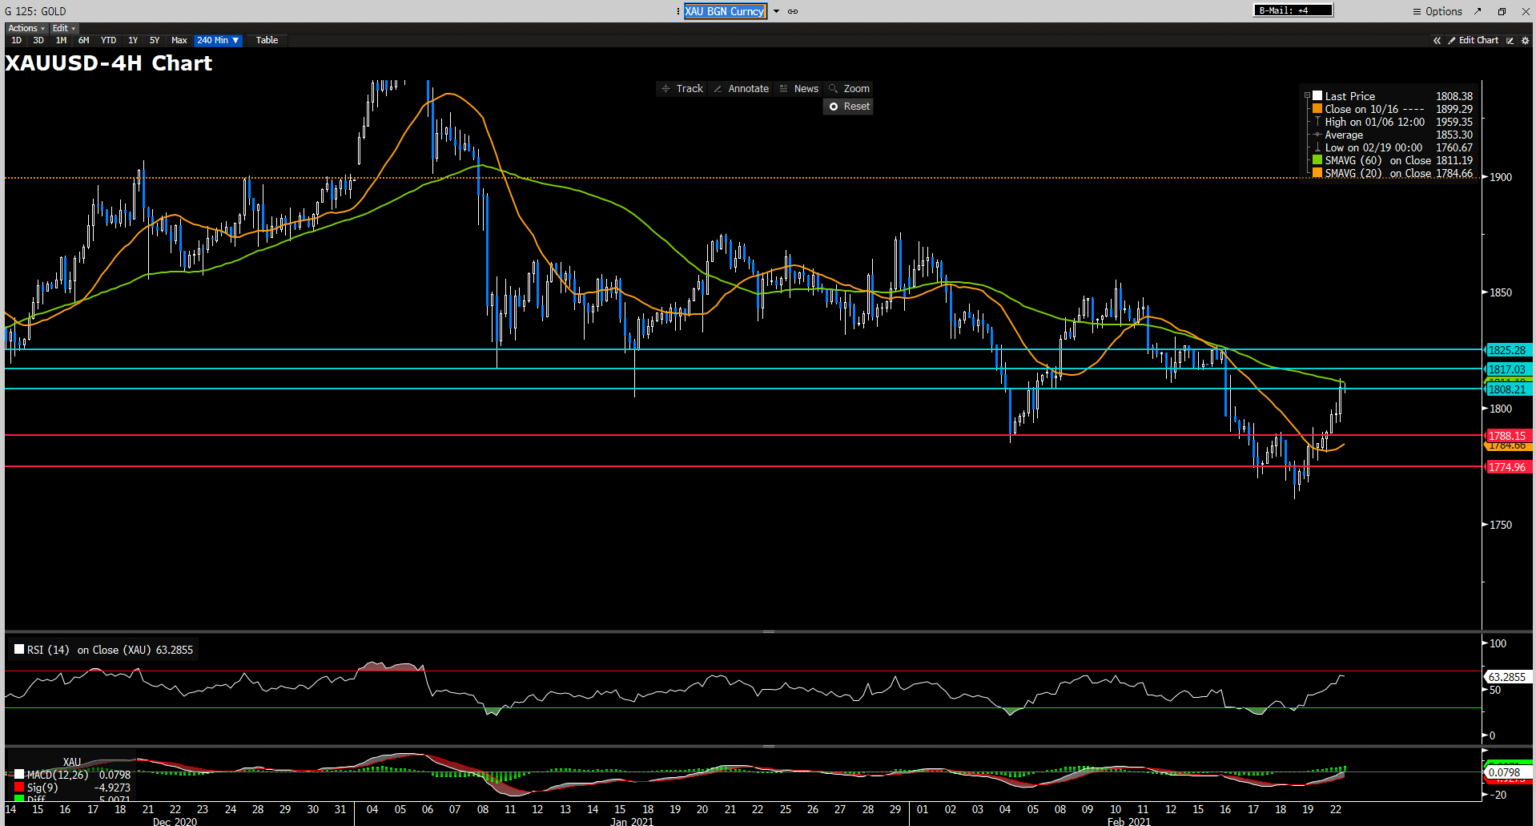
The precious metal extends its modest gain from last Friday amid a broad-based greenback weakness and advances north above $1800. At the time of writing, the XAUUSD is trading around $1808. Technically speaking, the recent rise of XAUUSD is supported by the MACD histogram. However, in the bigger picture, the price action of the precious metal has yet to overturn the bearish trend implied by the 60-Day SMAVG. The low 60s RSI indicate that the bulls are dominating the market at the moment, but there is little room for them to further extend their gains. If XAUUSD can sit wellabove the $1808 resistance, the next resistance level the bulls are within reach is $1817, followed by $1825. Conversely, the most immediate cushion for XAUUSD is $1788 and $1774.
Resistance: 1789, 1823, 1872
Support: 1765, 1691
Economic Data
|
Currency |
Data |
Time (TP) |
Forecast |
||||
|
GBP |
Average Earnings Index + Bonus (Dec) |
15.00 |
4.1% |
||||
|
GBP |
Claimant Count Change (Jan) |
15.00 |
35.0K |
||||
|
EUR |
CPI (YoY) (Jan) |
18.00 |
0.9% |
||||
|
USD |
CB Consumer Confidence (Feb) |
23.00 |
90.0 |
||||
|
USD |
Fed Chair Powell Testifies |
23.00 |
– |
||||
-
Global - English

-
United Kingdom - English
-
France - Français

-
Spain - Español

-
Portugal - Português

-
Italy - Italiano

-
Germany - Deutsch

-
Turkey - Türkçe

-
MENA - العربية

-
MENA - English
-
Asia - English
-
India - English

-
Indonesia - Indonesia

-
Japan - 日本語

-
South Korea - 한국어

-
Malaysia - Bahasa Malaysia

-
Malaysia - English
-
Philippines - English

-
Vietnam - Tiếng Việt

-
Thailand - ไทย

-
China - 简体中文

-
China - 繁體中文

This site uses cookies to provide you with a great user experience.
By using vtmarkets.com, you accept
our cookie policy.
Start trading with
VT Markets today


![]()
Follow us on:


![]()


