Daily Market Analysis
Market Focus
US equities slightly edged to the downside amid continuously rising US Treasury yields, hit as high as 1.36%. Soaring yields could derail the ongoing economic recovery by rising borrowing cost and depressing price. The S&P 500 Index fell 0.1% with materials and industrial stocks leading the gain whilst utilities suffered amid Texas power outages.

The Federal Reserve warned of significant risk in business bankruptcies and acute drops in commercial real estate prices in a report released on Friday. The committee said “Business leverage now stands near historical highs. Insolvency risks at small and medium-sized firms, as well as at some large firms, remain considerable.”
Bitcoin’s market value surpassed $1 trillion as price topped $55,000. The leading cryptocurrency has added more than $450 billion since 2021, data complied by Bloomberg show. Experts suggests FOMO (fear of missing out) may be creeping behind the scenes as various cryptocurrency prices constantly breaks higher ground.
The G7 group said they will work closely to defeat the coronavirus and rebuild their economy in a joint statement. Group members will “engage” with others, especially G20 countries including large economies such as China. Meanwhile Biden and Merkel condemned Beijing for its economic abuses.
Market Wrap
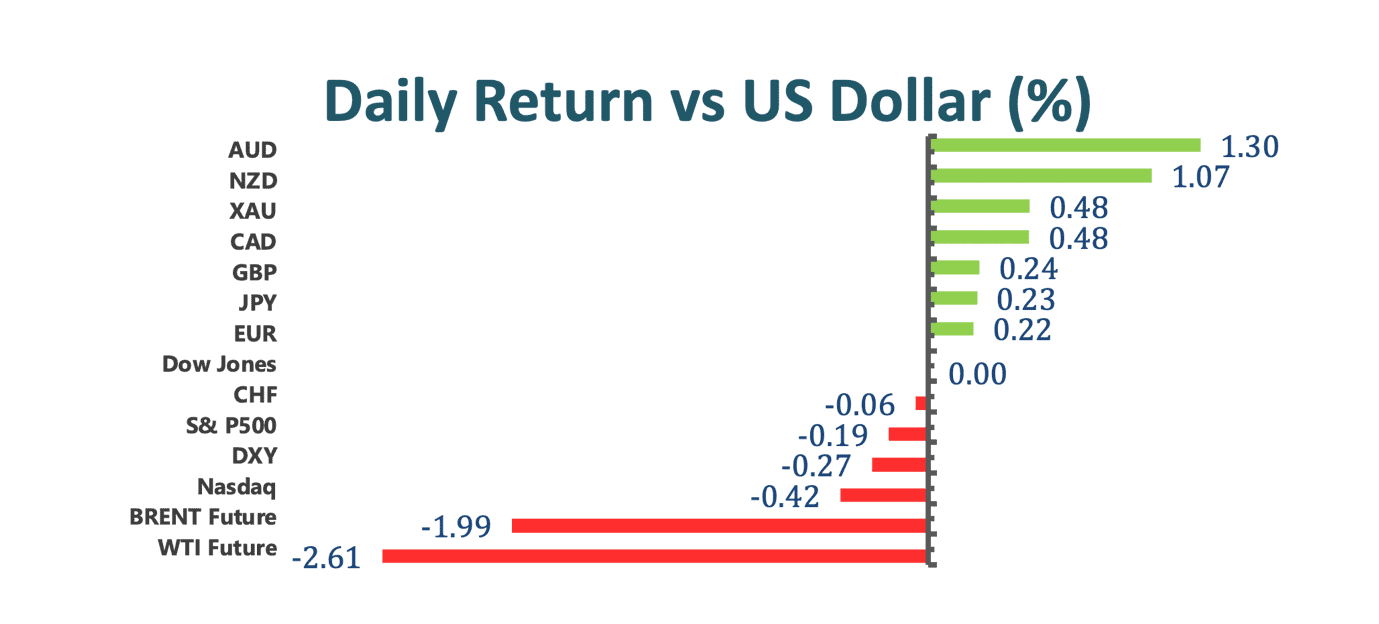
Main Pairs Movement
Euro dollar rallied 0.21% on Friday. February’s German Manufacturing PMI increased to 60.6 from previous month’s 57.1, and also beating expectation of 56.5. On the vaccination front, European countries are finally receiving more doses albeit EU commission’s hesitancy to take the AstraZeneca shots.
The US dollar tracking index dropped 0.25% as vaccine rollouts were slowed down by the freezing storm in Texas. The power outage also hampered down oil price, the WTI crude oil futures plunged 2.16%. Rising US treasury yields touched 1.36%, highest level since February 2020, and it is somewhat concerning to investors since such steep climb could spook risk sentiment and trigger “tantrum” in stock market. There are also speculations that the Fed will have to step in to initial an emergent yield curve control if yield continues to rise.
Cable extended its gain beyond 1.4 level. The groundbreaking move was inspired by upbeat PMI figure, both Manufacturing PMI and Services PMI came on top of estimates, printed 54.9 and 49.7 compared to forecasts of 53.2 and 41.0. Successful Covid19 vaccination rollout resumes in the backdrop of Sterling’s strength.
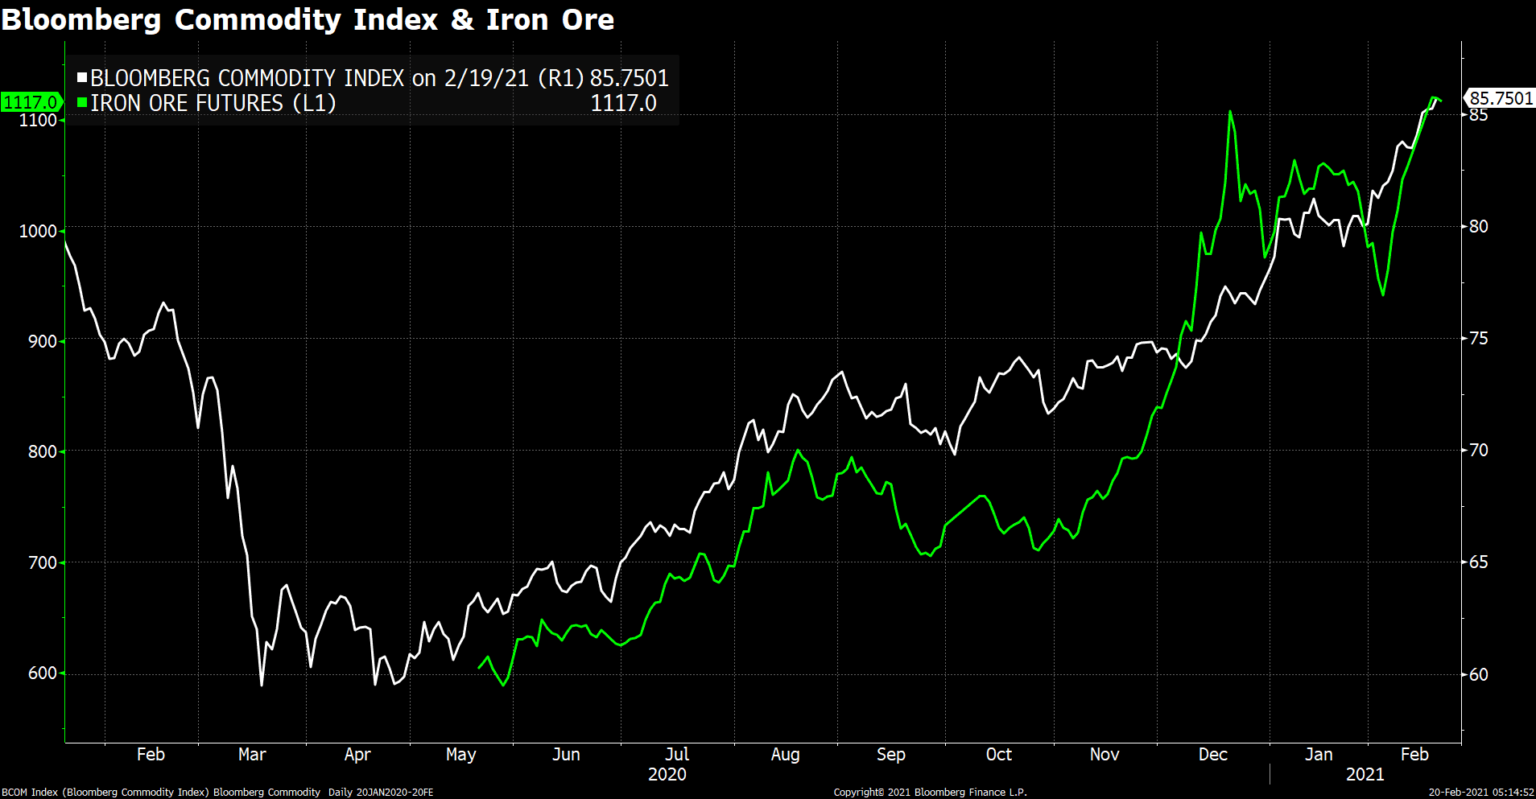
Antipodean Aussie and Kiwi soared 1.25% and 1.07% respectively. RBA noted earlier this week that the trade-weighted Aussie would normally be expected to be around 5% higher based on higher commodity prices, which were greatly boosted by the reflation theme. Aussie’s bullish run is also supported by cyclical recovery in Australia.
Technical Analysis:
GBPJPY (Daily Chart)
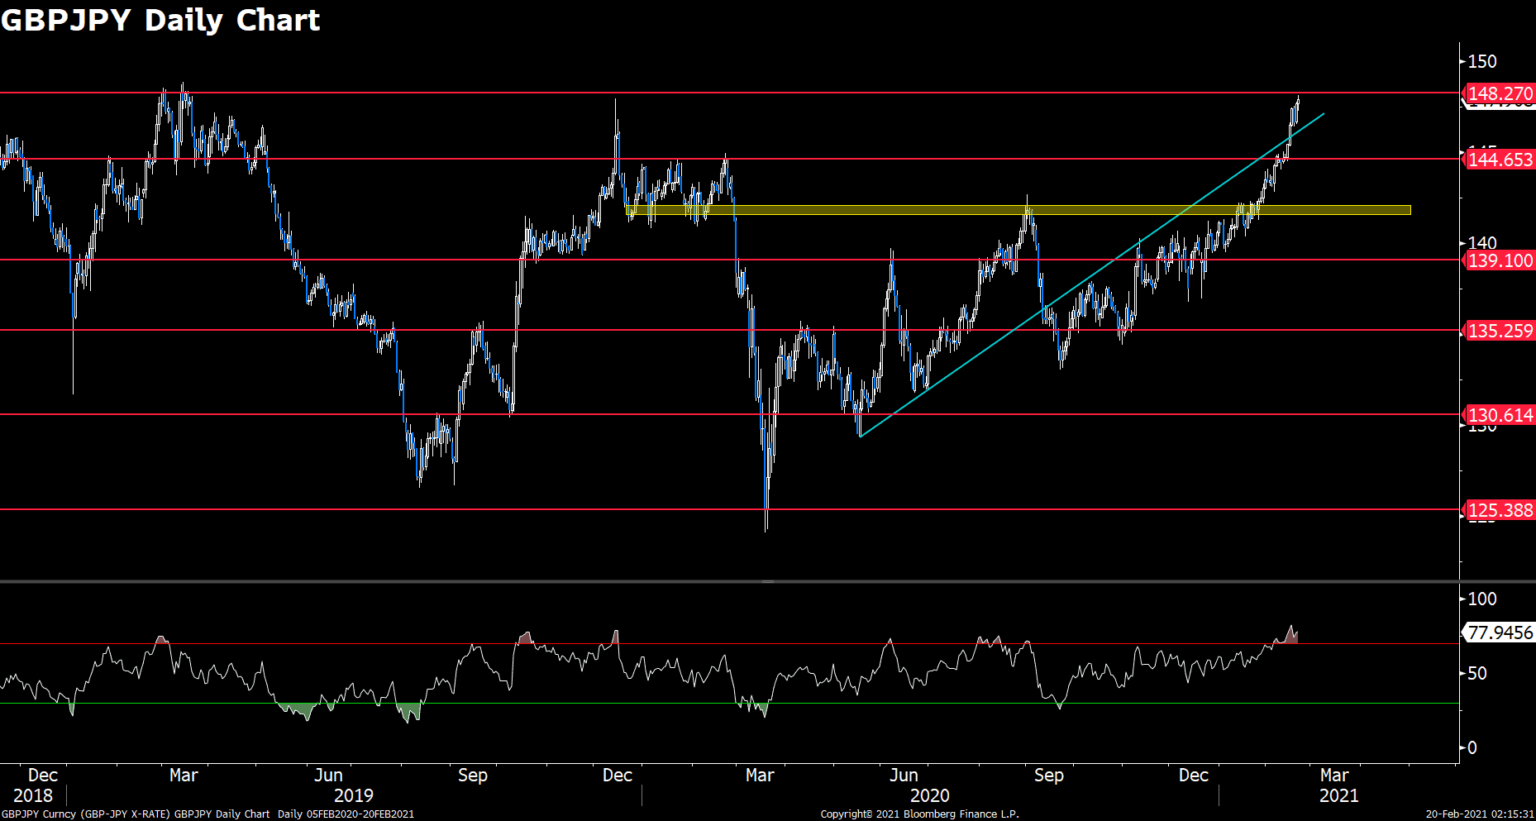
GBPJPY is marching straight into the long-lasting resistance line of 148.3. Upward momentum accelerated after sellers failed to guard resistance band between 141.6 and 142, rising US yields should be credited for the depression of the Japanese Yen. Given the lack of technical levels established between 144.65 and 148.27, it is likely that this pair will be capped by near resistance and retreat toward the blue trendline to create some supports prior to advancing forward. Moreover, RSI on the daily chart indicates price is overheated, which boost the possibility of a temporary pause from the bulls.
Resistance: 148.27, 152.83
Support: 144.65, 142
AUDUSD (Weekly Chart)
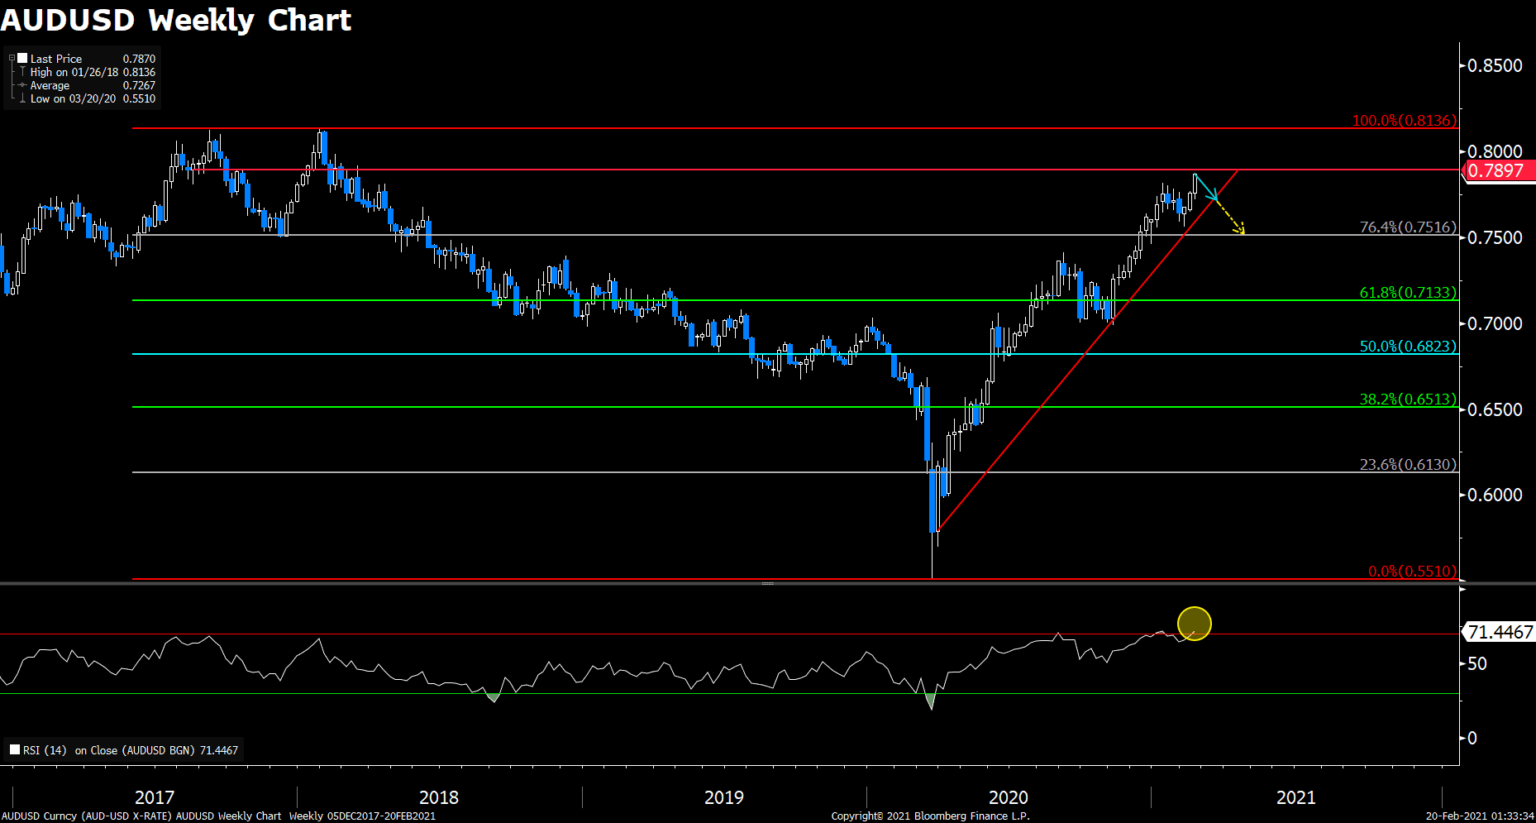
Aussie refreshed three-year high amid broad dollar weakness. The pair is approaching resistance of 0.79 dated back to August 2017, it has been rising on a steep slope since March 2020. Current consensus of reflation continues to bolster commodities price, which in turn ekes out the commodity linked Aussie. We have not seen any major retracements after it regained 0.7 handle, or any further validations of the ascending trendline. Combined with overheated relative strength index of 71.45, we expect some strong friction ahead of 0.79 hurdle, then a pullback toward 76.4% Fibonacci of 0.7516 or at least a test of the upward trendline.
Resistance: 0.79, 0.8, 0.8136
Support: 0.7516, 0.7133, 0.6823
XAUUSD (Daily Chart)
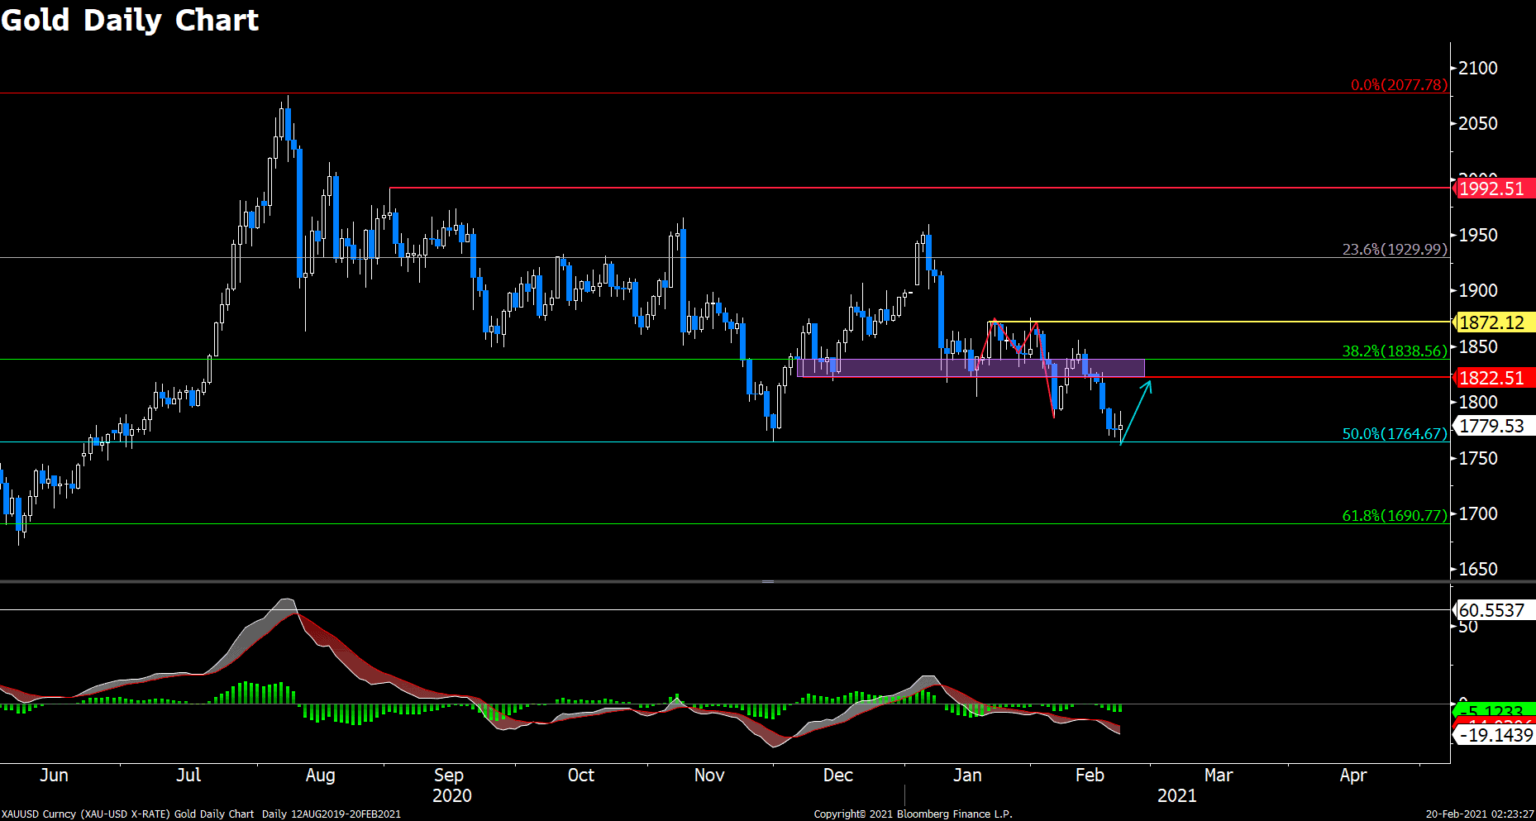
Gold’s value continues to deteriorate in the wake of constantly rising US bond yields. Price plummeted nearly $70 in five consecutive day, and speculators were playing tug-of-war during yesterday’s session, which created a nice Doji pattern. That being said, Doji usually implies a trend reversal, and this would be a bullish reversal in our case. Moreover, selling bias was eased upon failing to breach 50% Fibonacci of $1765, some rebound would give bidder some breathing room, and provide sellers better entry prices to keep the longer-term downtrend alive. On the upside, $1789 will act as a near resistance, next to $1823.
Resistance: 1789, 1823, 1872
Support: 1765, 1691
Economic Data
Click here to view today’s important economic data.