


Daily market analysis
January 12, 2021
Daily Market Analysis
Market Focus
U.S. stocks fell for the first time in five sessions as investors started the week in a cautious mood with equity prices near all-time highs. The S&P 500 was led lower by the real estate and communication services sectors, while energy companies were the biggest gainers in the benchmark index. The dollar strengthened against all its major peers, with demand supported by elevated Treasury yields.
Weighing on the minds of investors are worries that equities are running too hot and valuations are stretched at a time when major parts of the world are grappling with the worst of the pandemic.
Benchmark Treasury yields topped 1% last week on bets that Democratic lawmakers will enact big spending packages to drive the economic recovery out the pandemic. The move reset expectations for a range of asset classes and sparked debate over whether higher yields might jeopardize the current environment of easy financial conditions. Ten-year U.S. yields climbed to 1.136% on Monday, the highest level since March.
Bitcoin tumbled, with prices sliding as much as 20% on Monday. Some investors have said the digital currency’s recent gains defy logic and the U.K.’s financial watchdog issued a statement that consumers in should be prepared to lose all their money. The token traded down 13% at $33,160 as if writing.
Market Wrap
Main Pairs Movement
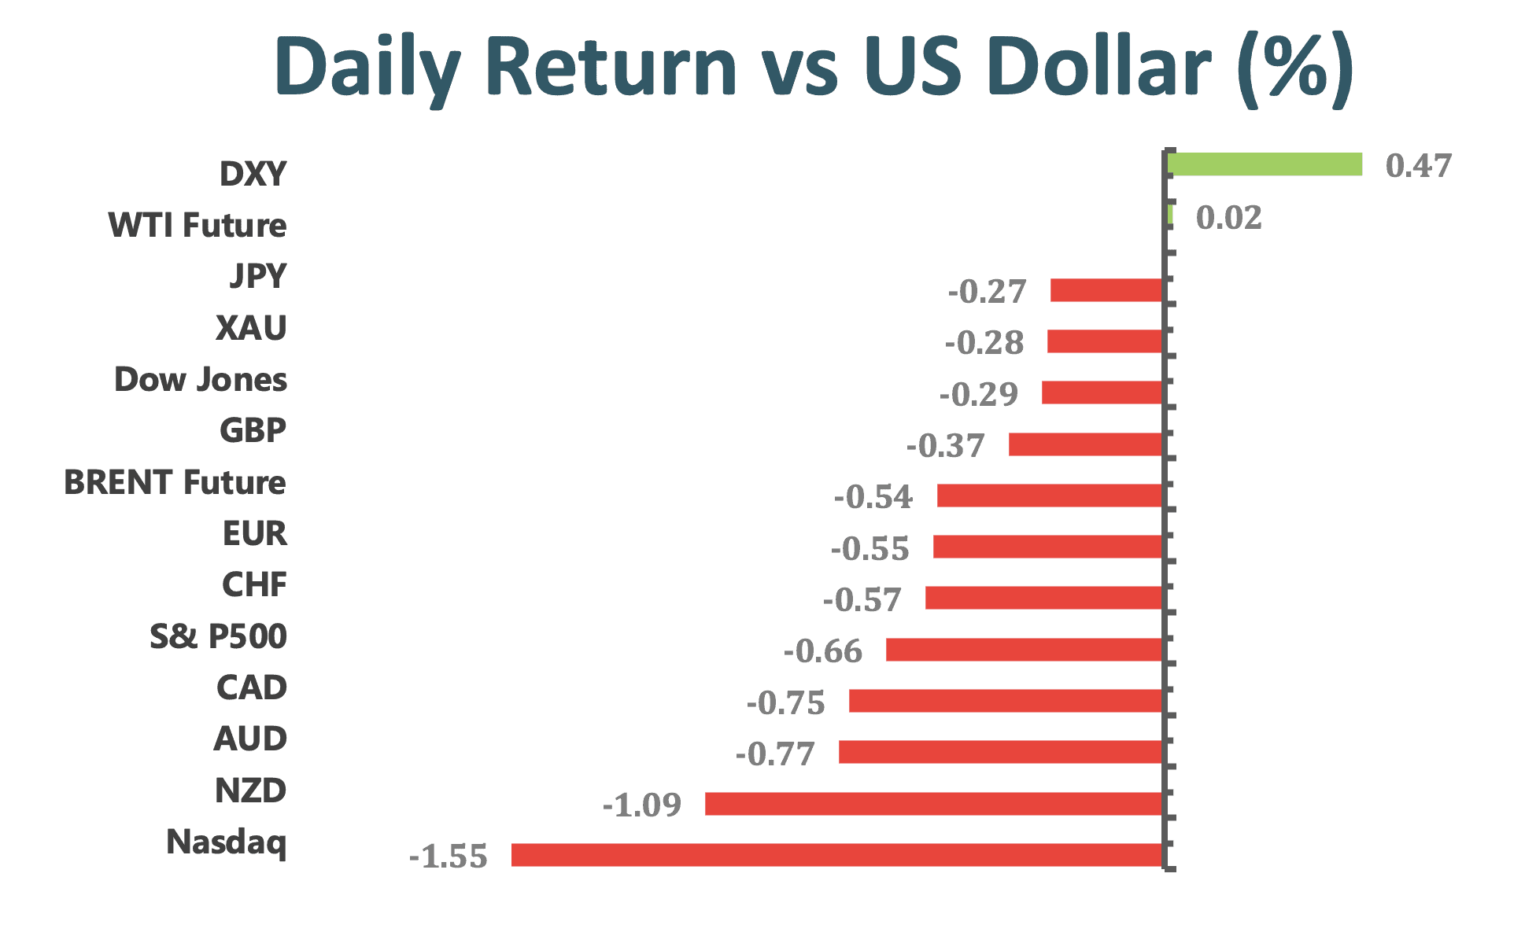
The dollar is on pace for its biggest three-day rally since September as the House will consider an article of impeachment against President Trump on Wednesday. The euro and yen held lower levels ahead of large options expirations set for Tuesday. Seasonal trends, which are favorable for the greenback in the early part of the year, support the currency.
The dollar also rose as speculative accounts cut their long bets on the euro, pound, and Australian dollars during the week through Jan. 5, according to data from the Commodity Futures Trading Commission.
The yen was the most resilient against the dollar while commodity currencies lead losses; the Norwegian krone was the worst performer. USD/JPY is +0.2% to 104.15; after climbing to 104.40, the highest in a month. The yen could gravitate towards the 104.00 level, a strike where $1.2b expire on Tuesday, trader says.
Technical Analysis:
AUDUSD (4 Hour Chart)
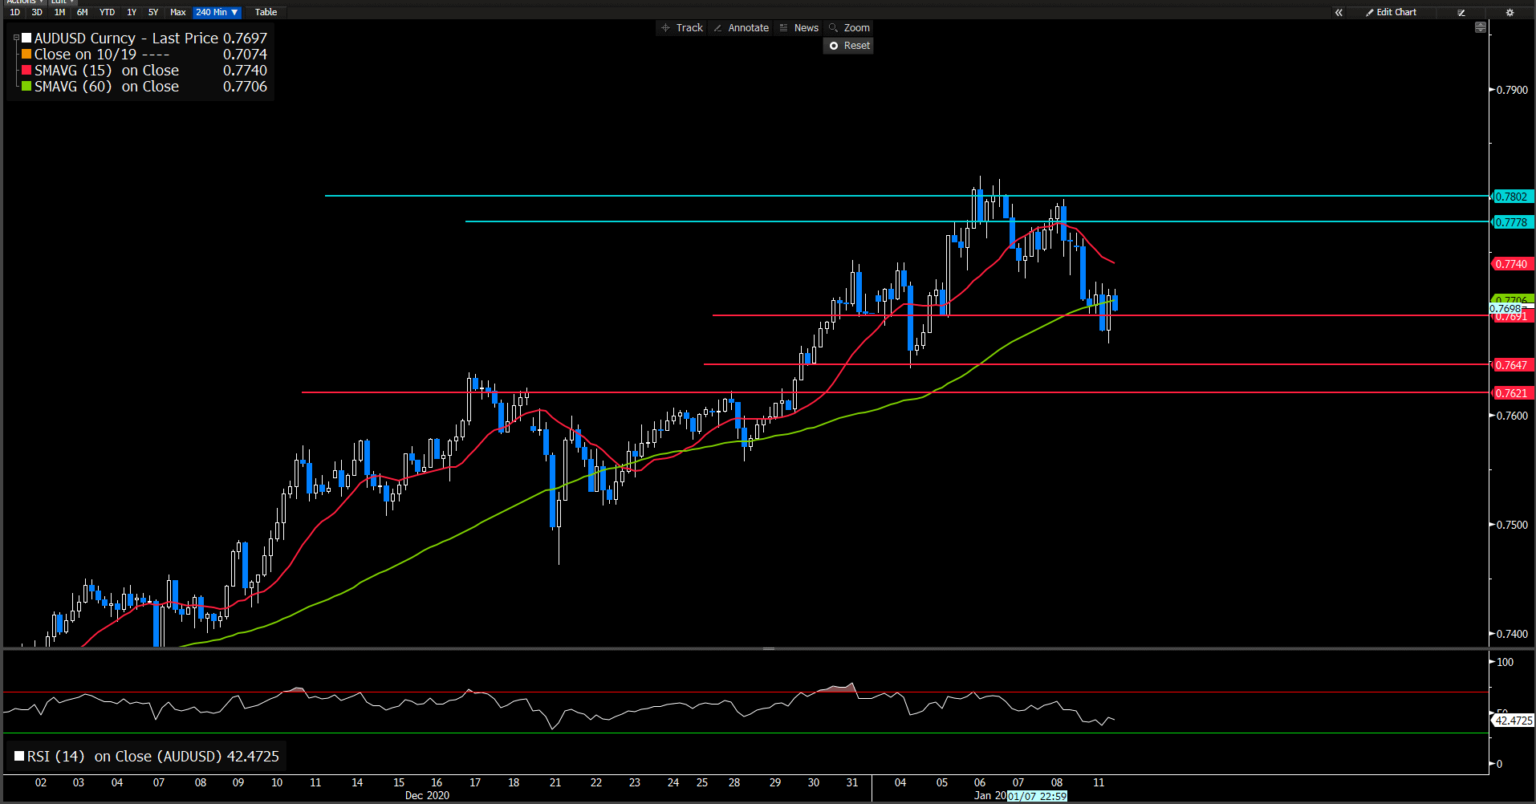
Aussie got beaten and under pressure as strengthen greenback threating the commodities-linked currency characteristic. Aussie pair dropped to the lowest in one week the previous day amid dollar momentum and Sino-Australia intense. Although the COVID-19 spread and the U.S. political jitters join tension between America and China to challenge the risks, expectations of heavy stimulus from Washington take the support of vaccine hopes to keep the bears away.
From technical view, short-term SMAVG indicator slide to negative side, but long-term remained upward momentum. Another one, RSI indicator close at 42.5 which suggesting a trifling bearish guidance. All of all, aussie movement seemingly mixed as technical suggestion, moreover, market news would impact the price change, especially for global trade news.
Resistance: 0.7778, 0.78
Support: 0.7691, 0.7647, 0.762
EURUSD 4 Hour Chart)
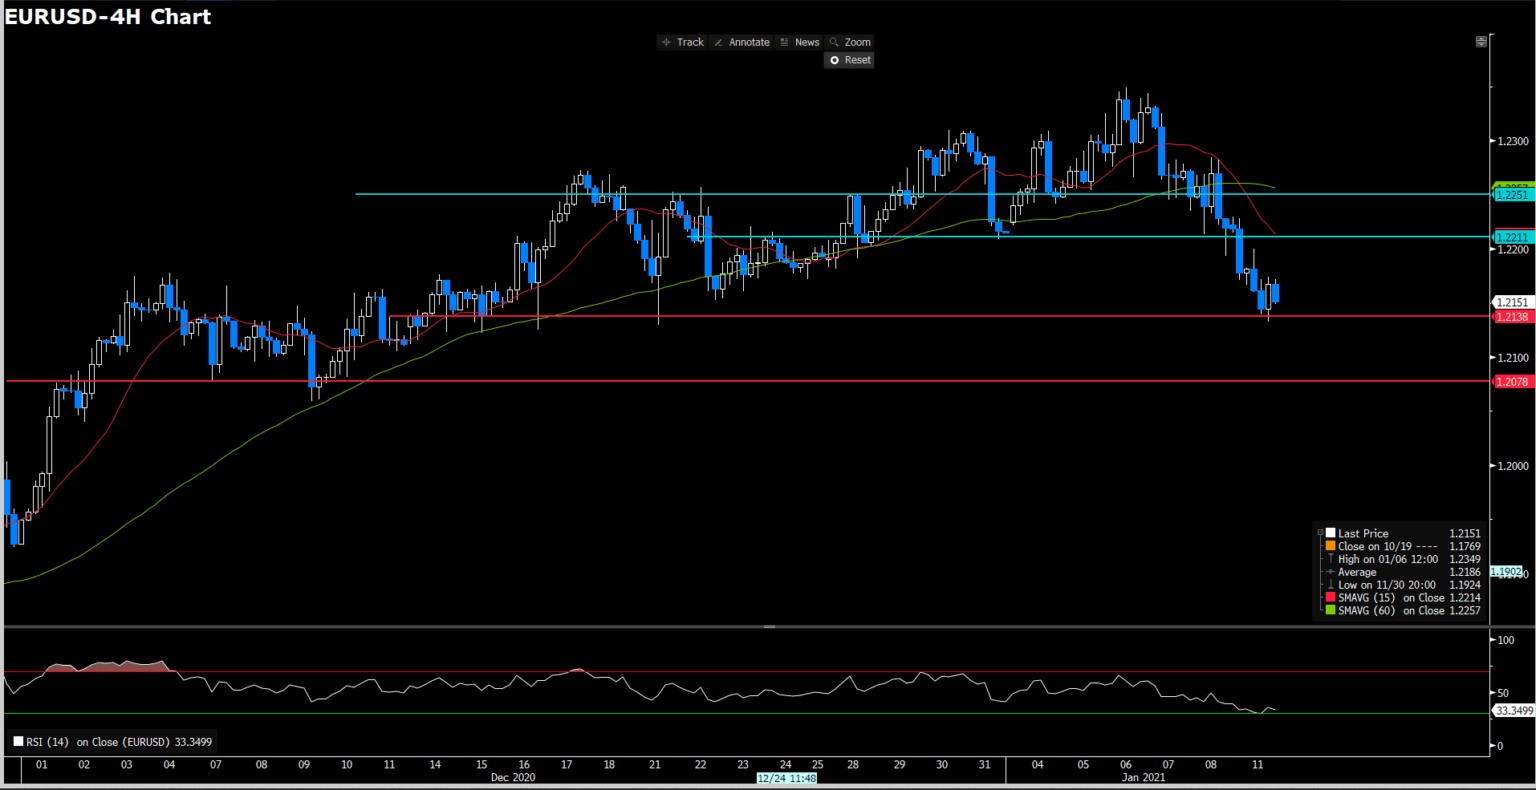
Euro dollar extended the descend trend at the start of this week as the greenback consecutive to recover from the near-3- year low hit last week as U.S. yield climb. As price action, euro seemingly breakthrough a m shape shoulder then fell to multi-day lows.
For Moving Average aspect, short-term indicator had death cross long-term indicator that suggesting a bearish perspective. For RSI aspect, indicator hold in bearish zone at 33 which is so close to the over sought area.
As the suggestion of technical perspective, we expect euro will continues under pressure of downward trend. However, price action is suggesting a critical support pivot at 1.2151 and 1.2078 follow behind.
Resistance: 1.2211, 1.2251
Support: 1.2138, 1.2078
XAUUSD (4 Hour Chart)
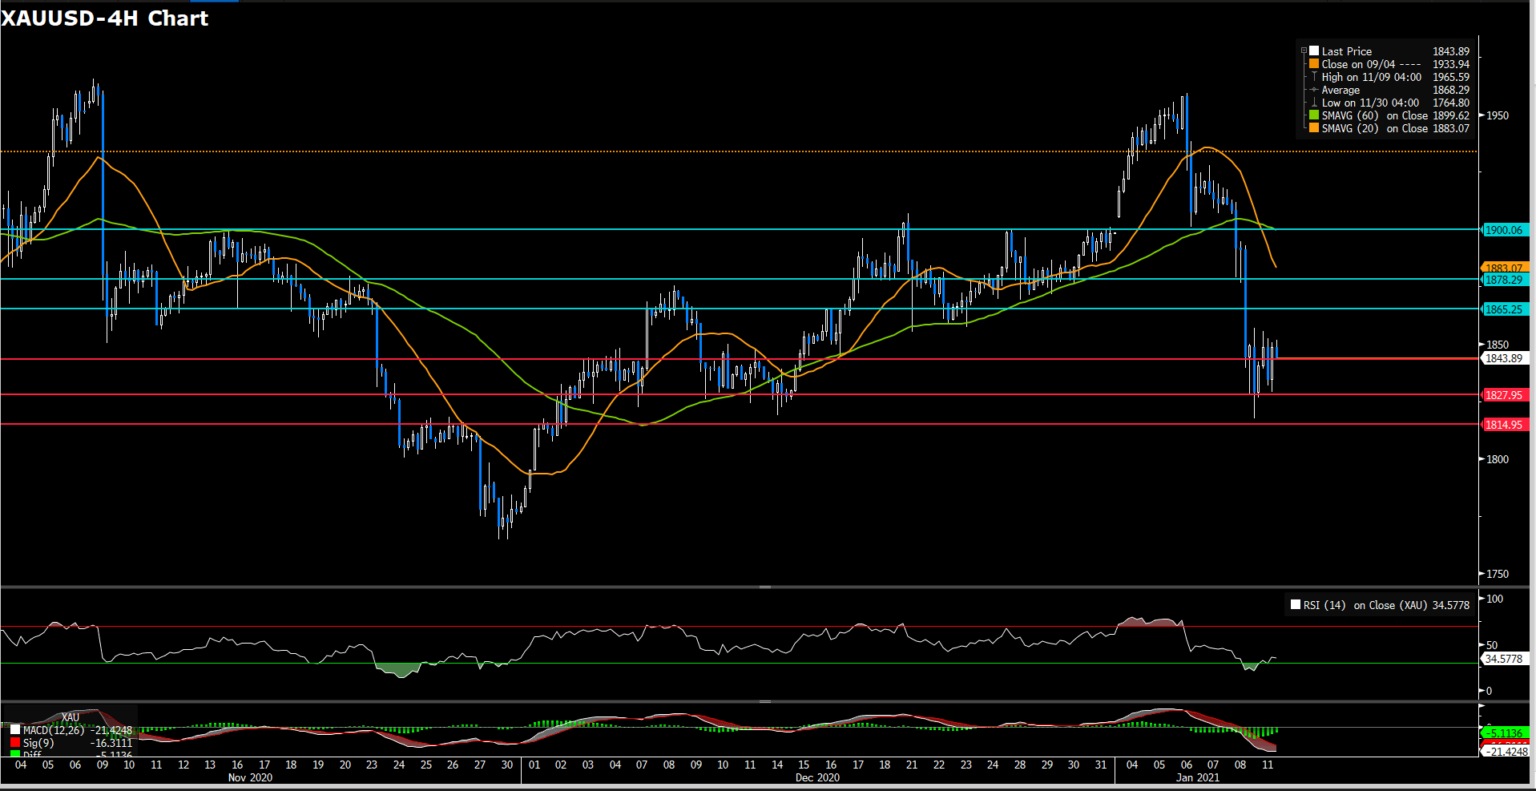
XAUUSD consecutive choppy all day as greenback continuous edged up which would typically be negative move for gold and treasury yield went up to nearly 9 months highest. Both of these factors would turn gold less captive as reduce the incentive to hold over fixed income and needless for hedge inflation.
For Moving Average aspect, short-term indicator had death cross long-term indicator that suggesting a bearish perspective. On the other hands, RSI indicator show 35 which turn back from over sought area at 17 once, nonetheless, it still mire in bearish momentum at currently stage. As the following suggestion, we expect gold market will still hold on current price channel which gap between first pivot support and resistance. Moreover, if price consecutive went flip side, the third pivot support should be a critical level. Otherwise, market seemingly will continue drop to year before low.
Resistance: 1865, 1878, 1900
Support: 1843, 1827, 1814
Economic Data
Click here to view today’s important economic data.
-
Global - English

-
United Kingdom - English
-
France - Français

-
Spain - Español

-
Portugal - Português

-
Italy - Italiano

-
Germany - Deutsch

-
Turkey - Türkçe

-
MENA - العربية

-
MENA - English
-
Asia - English
-
India - English

-
Indonesia - Indonesia

-
Japan - 日本語

-
South Korea - 한국어

-
Malaysia - Bahasa Malaysia

-
Malaysia - English
-
Philippines - English

-
Vietnam - Tiếng Việt

-
Thailand - ไทย

-
China - 简体中文

-
China - 繁體中文

This site uses cookies to provide you with a great user experience.
By using vtmarkets.com, you accept
our cookie policy.
Start trading with
VT Markets today


![]()
Follow us on:


![]()


