






The US dollar remained under pressure on Wednesday as markets stayed cautious ahead of key US inflation data and upcoming Federal Reserve communication. Traders are balancing expectations for future Fed policy adjustments against ongoing concerns around US fiscal conditions and broader demand for dollar assets.
Key points
- USDX traded near 98.89, close to a three-month low, as the dollar remained around its long-term trend indicator.
- Traders are focused on upcoming US PCE inflation data and Fed communication for clues on the future path of interest rates.
- USDX is testing the 98.99 200-day SMA, with 99.50 resistance and 98.50 support as key short-term levels.
Why worth watching
The US dollar remains closely linked to expectations for Federal Reserve policy, making upcoming inflation data a key driver for USDX. The market is watching whether PCE inflation supports a more accommodative Fed outlook or keeps interest rates elevated for longer.
Beyond inflation expectations, Treasury market movements are also influencing dollar sentiment. US 10-year Treasury futures have weakened in recent months, implying higher yields, but USDX has not strengthened alongside the move. This suggests rate support is being balanced by other factors, including changing Fed expectations and broader confidence in US assets.
For USDX, the immediate focus is whether price can reclaim the 200-day moving average or whether the recent decline from the July high continues.
Key trading levels
- At 101.55: Recent swing high and wider recovery reference
- At 100.00: Psychological resistance
- At 99.50: Short-term resistance
- At 98.99: 200-day SMA and key decision zone
- At 98.89: Current trade zone
- At 98.50: Immediate support
- At 98.00: Previous consolidation area
- At 97.50: Wider downside reference
- At 97.25: Recent low
Technical analysis
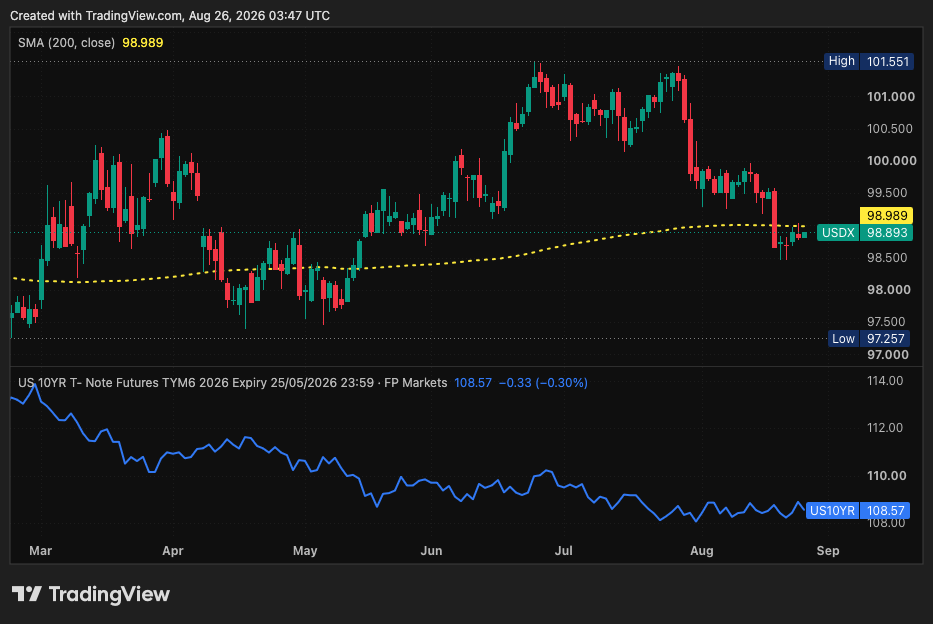
USDX is trading slightly below its 200-day SMA at 98.99, placing the index at an important technical decision zone. The dollar recovered from the 97.25 area earlier in the year before reaching a July high near 101.55, but momentum weakened after the failed attempt to extend above that level.
The recent decline has brought USDX back toward the 200-day moving average, where buyers and sellers are currently competing for control. A sustained move above 99.00–99.20 would suggest buyers are defending the long-term trend level, while continued weakness below the moving average would keep pressure on the broader structure.
The US10YR futures chart shows Treasury prices have moved lower in recent months, implying that US yields have risen. However, USDX has not responded with a similar recovery, showing that higher yields are being offset by other dollar drivers, including Fed expectations and market confidence.
The immediate technical range sits between 98.50 support and 99.50 resistance.
A move above 99.50 would improve the short-term structure and bring 100.00 back into focus. A break below 98.50 would weaken the setup and expose 98.00.
- Bullish scenario: USDX reclaims and holds above 99.00–99.20, confirming buyers are defending the 200-day SMA. A sustained recovery could bring 99.50 and 100.00 into focus.
- Bearish scenario: USDX fails to recover above the 200-day SMA and breaks below 98.50. This would signal renewed selling pressure and could expose 98.00 followed by 97.50.
Disclaimer
The price levels and trade scenarios above reflect the author’s view at the time of writing and do not represent financial advice or an official recommendation from VT Markets. Traders should conduct their own analysis and manage risk carefully.
Next market drivers
Traders are watching the upcoming US PCE inflation report, Fed Chair Kevin Warsh’s Jackson Hole speech, Treasury market movements and broader dollar sentiment. The market focus remains on whether inflation data changes expectations for future Fed policy decisions.
Trade USDX with VT Markets
USDX CFDs provide exposure to movements in the US dollar index, allowing traders to take a view on dollar strength or weakness without directly holding the underlying currency basket.
Because the dollar influences global markets, USDX is closely watched alongside interest rates, inflation expectations, commodities and major currency pairs. Traders can use market analysis tools to monitor price movements and key technical levels as dollar conditions change.
Explore Index and Forex CFDs with VT Markets
Frequently Asked Questions
What is happening to DXY?
DXY is consolidating near three-month lows as traders assess upcoming US PCE inflation data and Federal Reserve policy expectations. The market is monitoring whether incoming data changes expectations for future interest rate decisions, while the index remains near its 200-day moving average.
What is the difference between DXY and USDX CFDs?
DXY, also known as the US Dollar Index, is a benchmark that measures the value of the US dollar against a basket of major currencies.
USDX CFDs allow traders to speculate on movements in the Dollar Index without directly owning the underlying index. This provides exposure to changes in dollar strength or weakness while using CFD trading tools.
Can I trade USDX CFDs with VT Markets?
Yes. VT Markets offers USDX CFDs, allowing traders to monitor and trade movements linked to the US Dollar Index while using market analysis tools to track key drivers such as Federal Reserve expectations, inflation data, interest rates and currency market conditions. Trade now.
Start trading now — click here to create your real VT Markets account.








