


February markets consolidated after late 2025 gains as investors balanced earnings resilience with valuation and policy risk. This monthly recap covers forex, gold, oil, indices, and crypto, to map what to watch in March for key technical zones and triggers.
Market Recap of February
February delivered a broad pause across risk assets after strong gains late last year. Major equity indices traded sideways for the most part as investors weighed resilient earnings against stretched valuations. The markets experienced a brief but sharp sell-off on the 12th for AI and tech positioning, reflecting profit-taking and rotation out of a crowded sector. Volatility rose only modestly and then stabilised, which points to repositioning rather than a fundamental break.
Macro data stayed in control. Inflation prints suggested disinflation progress had slowed, so markets trimmed aggressive rate-cut expectations and gave more weight to a higher-for-longer Fed path.
The USD weakened modestly as rate differentials narrowed and risk sentiment improved outside the US. Gold consolidated after its late-January correction, while oil stayed rangebound as disciplined supply met uneven demand signals.
Major Currencies
Forex markets largely held to established ranges as the USD softened. Rate differentials narrowed, and the market priced less policy divergence than it did in late 2025, which reduced support for broad USD strength.
USDJPY stood out. JPY outperformed as Japanese yields edged higher and markets continued to price a gradual normalisation from the Bank of Japan. Improved real yield differentials and safe-haven demand during the mid-month equity pullback added to JPY strength. Elsewhere, EURUSD benefited from USD softness but stayed capped by weak eurozone growth signals. Event risk drove most intraday volatility, with inflation releases and central-bank repricing creating the sharpest moves.
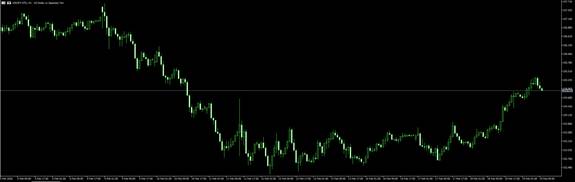
Fig. 1: USDJPY strengthened as markets priced gradual BOJ normalisation.
Price action suggests that yield differentials, rather than risk sentiment alone, drove the move.
Watch whether USDJPY holds below the latest rebound high, as a renewed push higher in US yields could quickly lift the pair.
Popular Metals
Gold and silver consolidated in February after a sharp correction in late January. The pullback reflected profit-taking, a stabilisation in real yields, and a repricing of near-term Fed rate-cut expectations.
Selling pressure faded after the initial drop. Central-bank demand continued to underpin gold, while hedging demand linked to geopolitical risk limited a deeper retracement. Silver underperformed gold on a relative basis, which aligns with its higher sensitivity to industrial demand. Both metals held defined ranges as bond yields, and the USD moved without a clean trend.
Inflation data and shifts in Fed pricing remain the main drivers until March.
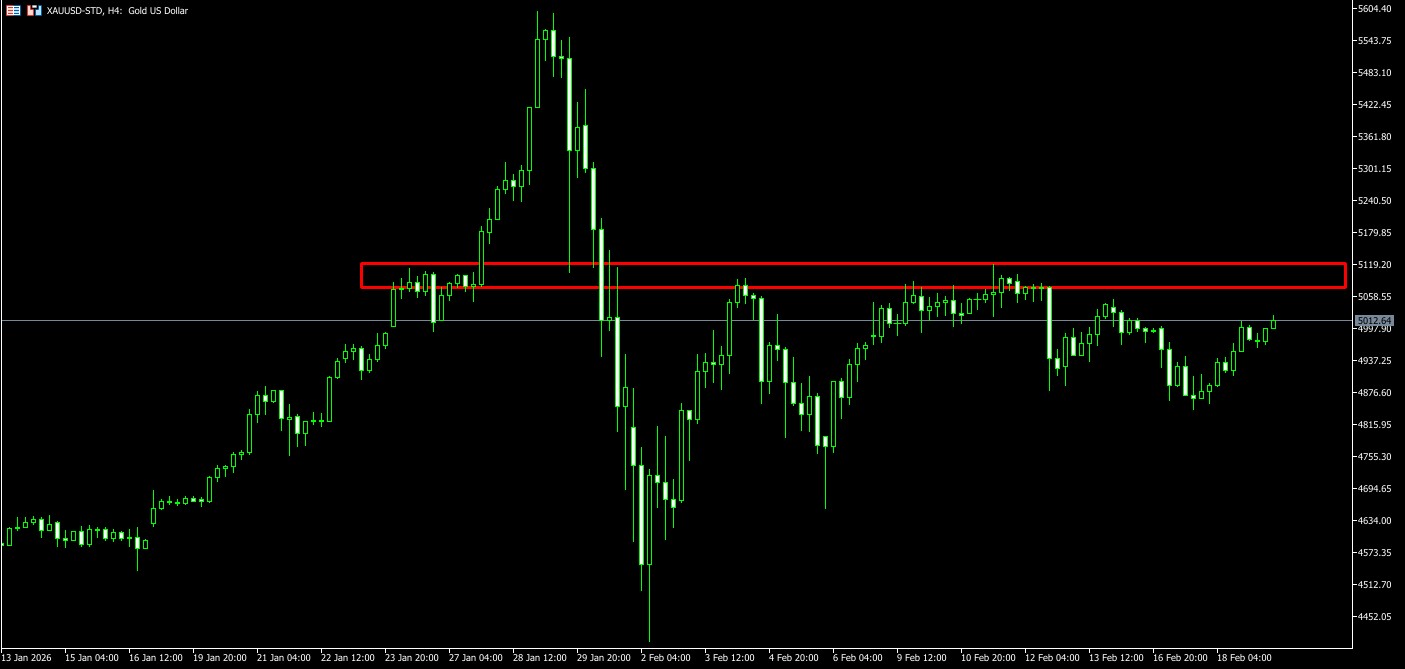
Fig. 2: Gold consolidated below a key resistance zone after the late-January correction
February price action shows buyers defending dips while sellers control rallies. A clean break above the resistance band would point to easing real yields, while rejection keeps gold in consolidation.
Oil
Oil traded in a tight range throughout February, with lower day-to-day volatility than in earlier months. Disciplined supply offset uneven demand signals, leaving crude without a clear directional catalyst.
US production growth stayed steady but did not disrupt the balance. On the demand side, mixed data from China and Europe limited upside momentum, while inventories remained around seasonal norms. A consolidating USD and range-bound bond yields also restrained commodity flows. With fewer geopolitical shocks, the risk premium faded, and technical support and resistance levels guided the price.
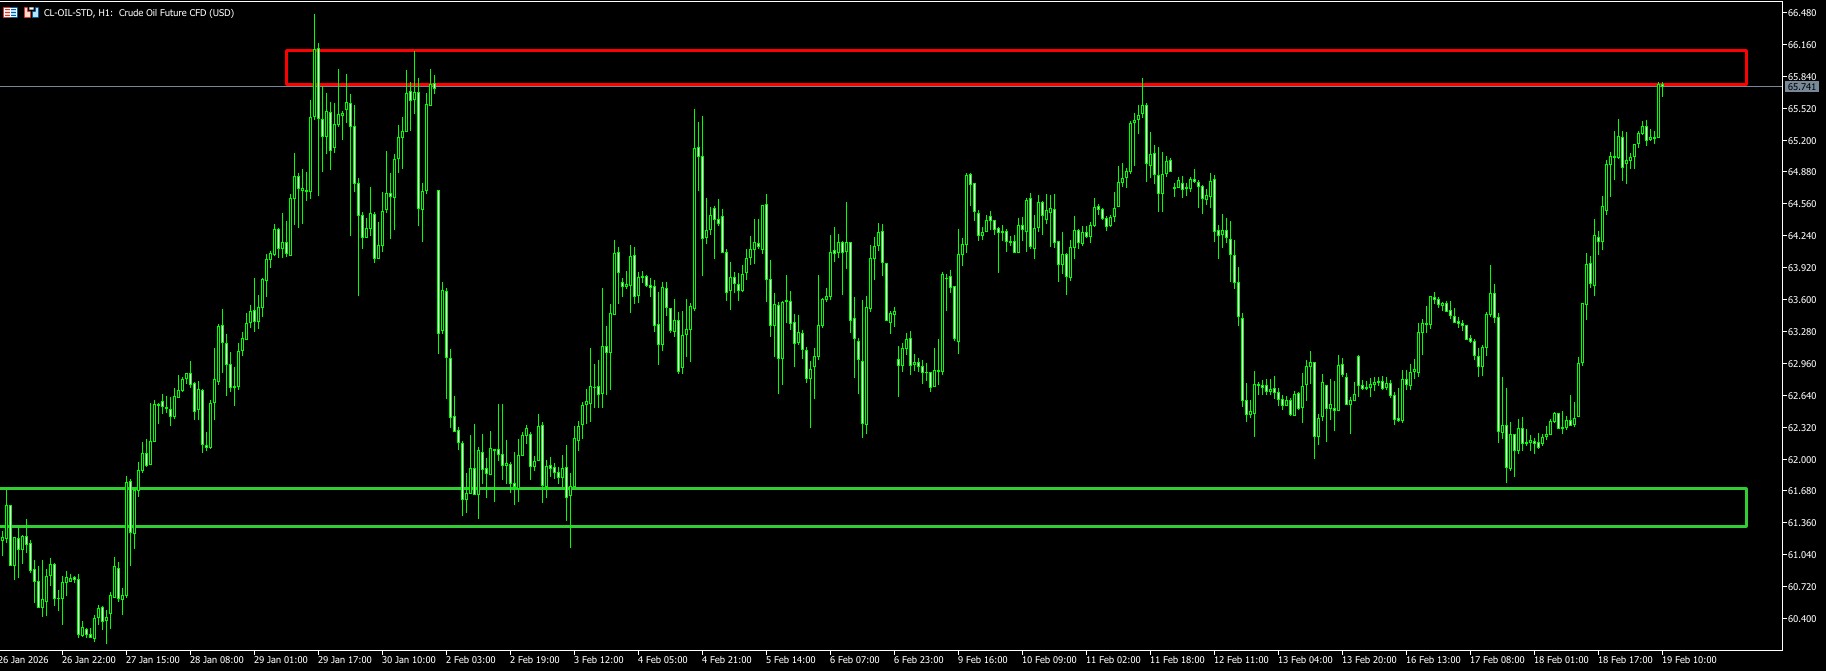
Fig. 3: Oil remained rangebound as supply discipline met uneven demand
The chart highlights a defined technical box. A break typically needs a catalyst such as a demand surprise, an inventory shock, or a renewed geopolitical premium.
Indices
Global equity markets consolidated with several short-lived volatility bursts. The FTSE 100 pushed to fresh record highs above the 10,000-point mark, supported by strength in energy and financials.
In the US, the Dow Jones also printed record highs on the 50000 milestone in the month before a modest pullback as investors reduced exposure. The Nasdaq corrected more sharply as traders took profit in AI and tech leaders. Even so, the move still reads as profit-taking and repositioning, with price action holding within the broader range that has been in place since October 2025.
Rotation shaped February’s tape. Value, industrials, and small caps outperformed as investors favoured sectors with clearer near-term earnings visibility and lower valuations.
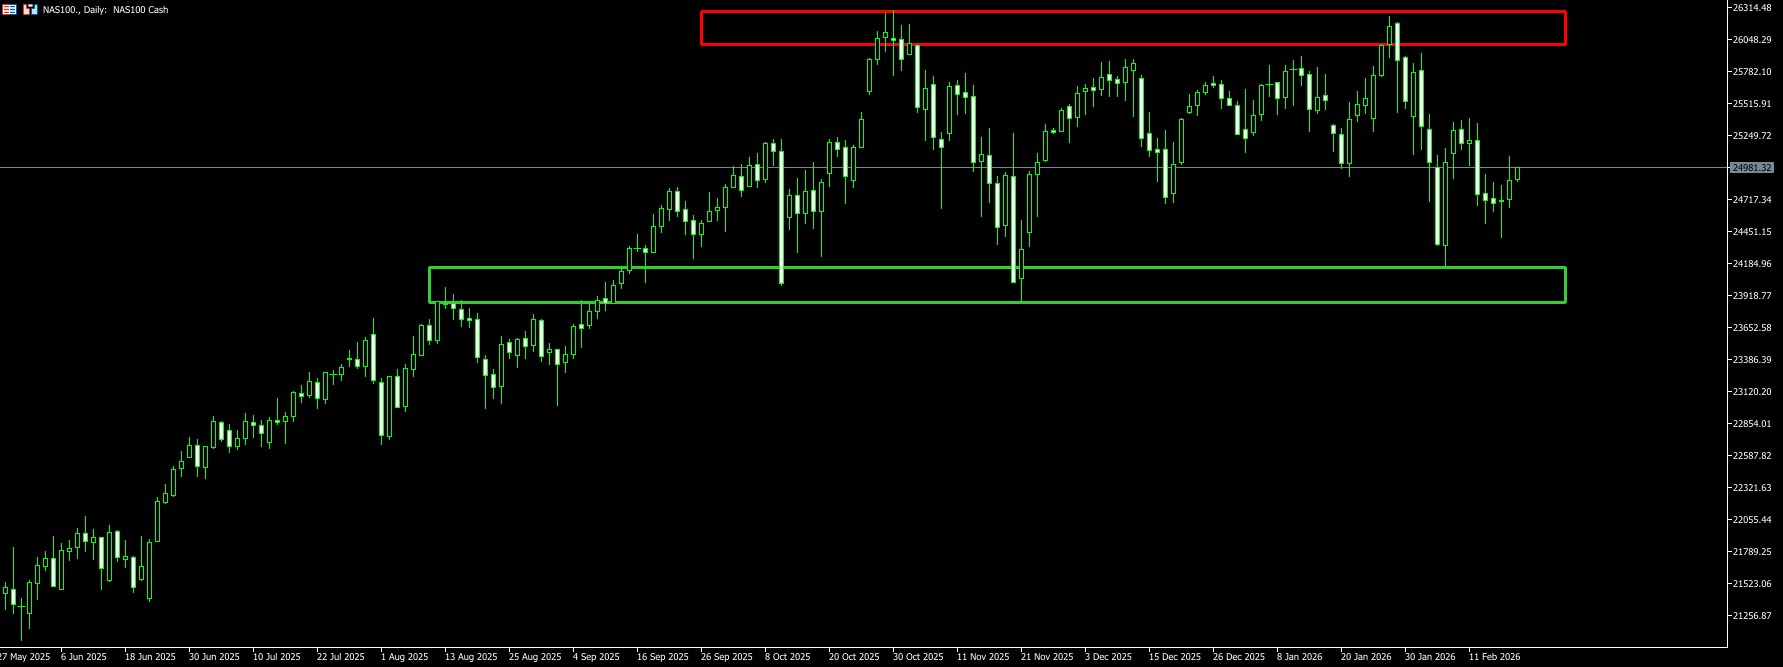
Fig. 4: Nasdaq stayed rangebound despite the AI-led pullback
The upper band continues to cap rallies, while support has held repeated tests. A break above resistance would signal renewed mega-cap leadership. A break below support would suggest deeper de-risking. Watch whether February’s rotation persists or whether flows return to mega-cap technology.
Crypto
Crypto markets weakened in February, with Bitcoin leading a sharp sell-off, dropping over 5% as it broke below key technical support before stabilising. Funding rates reset lower and open interest declined, which reduced leverage and improved the positioning backdrop.
Several late-month signals aligned with early base-building conditions. Exchange inflows stayed contained, ETF-related flows remained broadly stable, and realised volatility compressed into the month-end. Large participants appeared more selective, adding exposure to weakness rather than chasing momentum.
On the theme side, real-world asset tokenisation continued to gain traction through pilot issuance and institutional partnerships. AI-linked blockchain narratives also resurfaced as equity markets rotated out of crowded tech, though this theme remains sensitive to broader liquidity conditions.
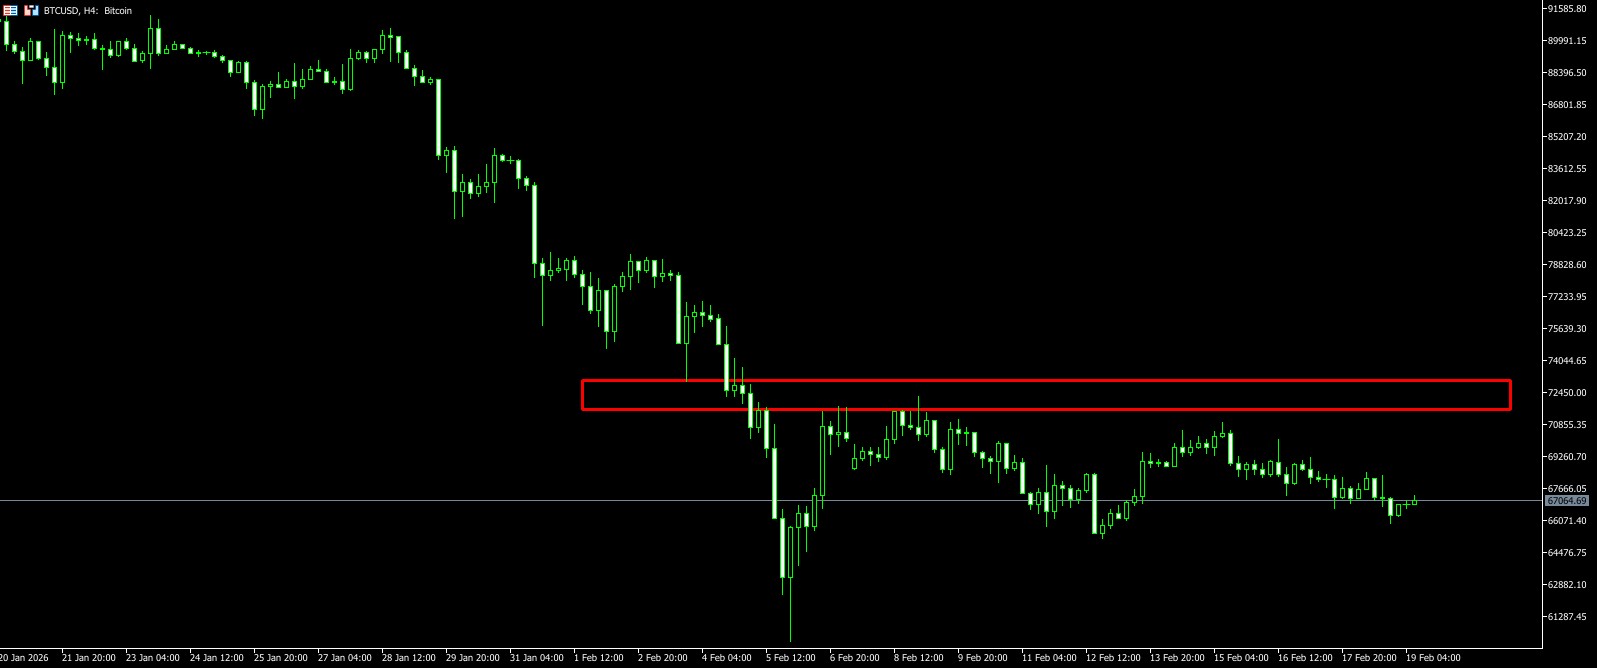
Fig. 5: Bitcoin consolidated below resistance after February weakness
The chart maps a classic reset pattern, with lower leverage and tighter volatility. A reclaim of resistance would improve upside odds, while rejection keeps the market in a base-building regime. Moving forward, focus is on liquidity, ETF flows, and the impact of scheduled token unlocks.
Early Signals to Watch in March 2026
March starts with markets sitting at clearer technical boundaries after February’s consolidation. The next directional phase will likely depend on whether macro data validates easier policy conditions or reinforces the higher-for-longer narrative.
Inflation remains the swing factor. Renewed progress in disinflation would strengthen the case for mid-year easing and support risk assets. Sticky prints would push rate-cut pricing further out and can lift real yields.
Labour data matters for the same reason. Signs of softer hiring, moderating wage growth, or rising participation would reduce policy pressure, while persistent tightness can keep yields supported.
The USD is the cross-asset barometer. Continued USD weakness tends to support commodities and emerging markets, while a stronger USD can tighten conditions and weigh on equities and crypto. FX volatility can rise if US growth diverges further from Europe and Asia.
Positioning resets and central-bank communication will decide whether February’s ranges break into trends or extend into another month of consolidation.
Key Levels and What They Mean
Use February’s range boundaries as the first decision points in March. If price breaks and holds beyond these zones on higher participation, the market may shift into a trend phase. If price rejects, expect mean reversion strategies to remain effective. Confirmation matters more than speed early in the month, particularly around major data releases.
Frequently Asked Questions
What Is A Monthly Market Recap And Outlook?
A monthly recap summarises the drivers that moved markets in the prior month and maps the triggers that can shape price action in the month ahead.
Why Do Fed Rate Expectations Move Gold?
Gold often responds to changes in real yields. When markets price lower policy rates or falling real yields, gold can find support. When real yields rise, gold can face pressure.
Why Does USDJPY Track Yield Differentials?
USDJPY often reflects the relative return investors can earn on USD versus JPY assets. Changes in US and Japanese yields can shift those incentives and drive the pair.
What Does Consolidation Mean In Trading?
Consolidation describes range-bound price action where buyers and sellers reach a temporary balance. These ranges often break when fresh information changes expectations.
Why Do Mega-Cap Tech Moves Affect Broader Indices?
Large technology names carry heavy index weight, so profit-taking or re-risking in that group can move index performance even if other sectors hold steady.
Written by Ross Maxwell, Global Strategy Operations Lead, VT Markets


