Market Focus
Wall Street’s three major indexes ended sharply lower on Thursday after better-than-expected U.S. consumer price data and subsequent comments from Federal Reserve officials stoked fears that the central bank will raise interest rates sharply to fight inflation, pushing the 10-year U.S. Treasury yield higher , making the yield topped 2%, and tech stocks fell after being under pressure. Regarding the CPI data, U.S. Labor Department data showed that consumer prices surged 7.5% on a year-over-year basis, beating economists’ expectations for a 7.3% increase and the largest annual inflation increase in 40 years. At the end of the market, the Dow Jones Industrial Average fell 1.47% to 35,241.59 points, the S&P 500 index lost 1.81% to 4,504.06 and the Nasdaq Composite Index slipped 2.1% to 14,185.64 points. The S&P 500 is now down about 5% in 2022, the Nasdaq is down about 9%.
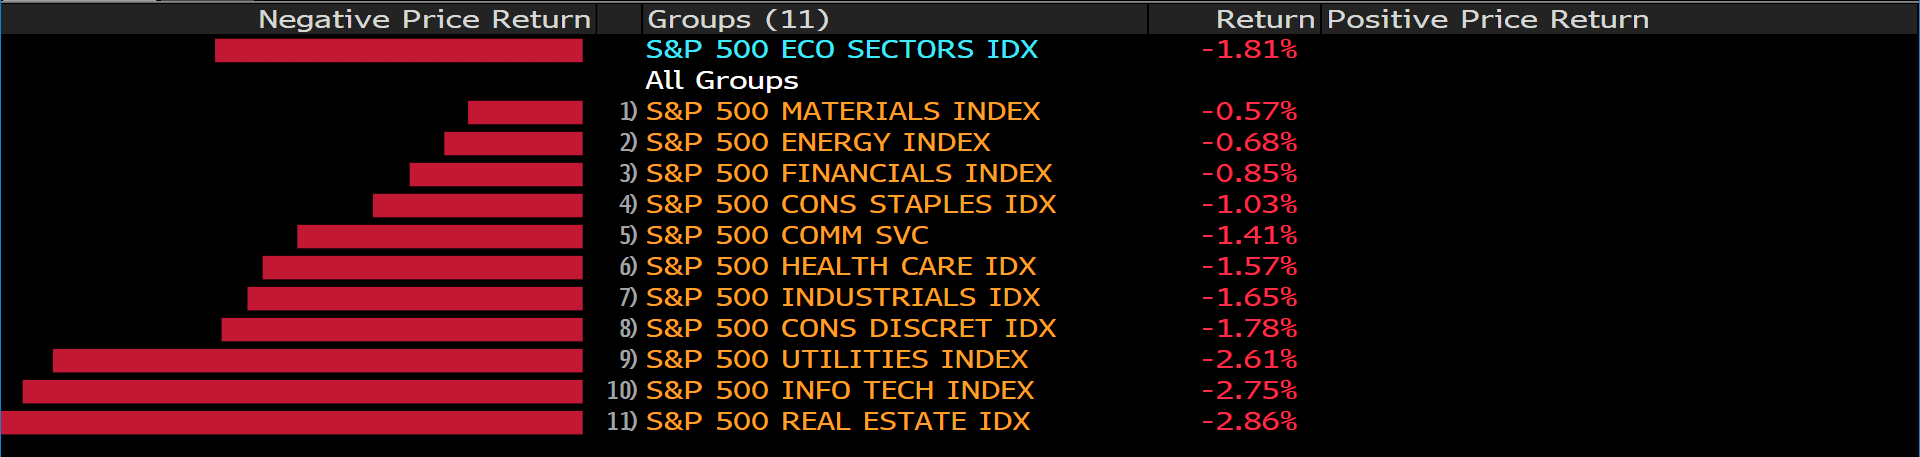
The 11 sectors of the S&P 500 were dismal. The biggest loser was the real estate sector, down 2.86%, followed by the information technology and utilities sectors, down 2.75% and 2.61%, respectively. Large-cap stocks rose Apple, Alphabet, Meta Platforms, Amazon all fell more than 1%, Tesla, Nvidia and Microsoft all fell about 3%. However, there were some positives in the market, like their impressive quarterly earnings. Coca-Cola rose 0.5% after reporting fourth-quarter results that beat Wall Street expectations, and Walt Disney rose more than 3% after reporting better-than-expected quarterly results, helped by strong growth in its parks business and upbeat subscriber numbers.
Main Pairs Movement:
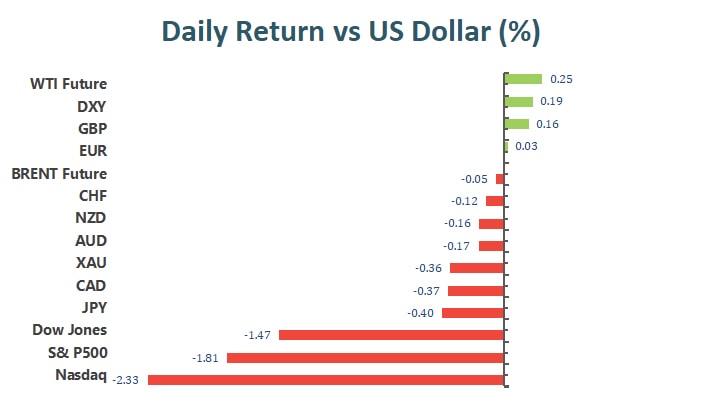
As the soared on the CPI data, pushing the government bond yields another high level. U.S. 10-year yields surged to 2.02%, crossing the 2% threshold for the first time since 2019, while 2-year yields were as high as 1.51%. The rising yield, providing some momentum for the dollar, which rose 0.51% after the data, but then retreated 0.84%.
As the mixed movement on the greenback, competitors also oscillated intraday. EUR/USD topped 1.14948 level, a new 2022 high, then retreated to 1.14270 area. Earlier in the day, the European Commission raised its inflation forecast for this year from 3.5%, but still expects inflation to fall to 1.7% in 2023. Sterling followed a similar move, with GBP/USD holding on to intraday gains after hitting a monthly high of 1.3643 but then closing just below the 1.3600 level.
Gold jumped to $1,841.83 per ounce but fell back to the $1,830 area. Crude oil prices were little changed at the close. OPEC raised its forecast for crude demand in 2022 by 100K bpd, but reported an increase of 64K bpd in January, lagging the increase in OPEC+ commitments. At the end, WTI closed at $90.03 a barrel and Brent at $91.36 a barrel.
Technical Analysis:
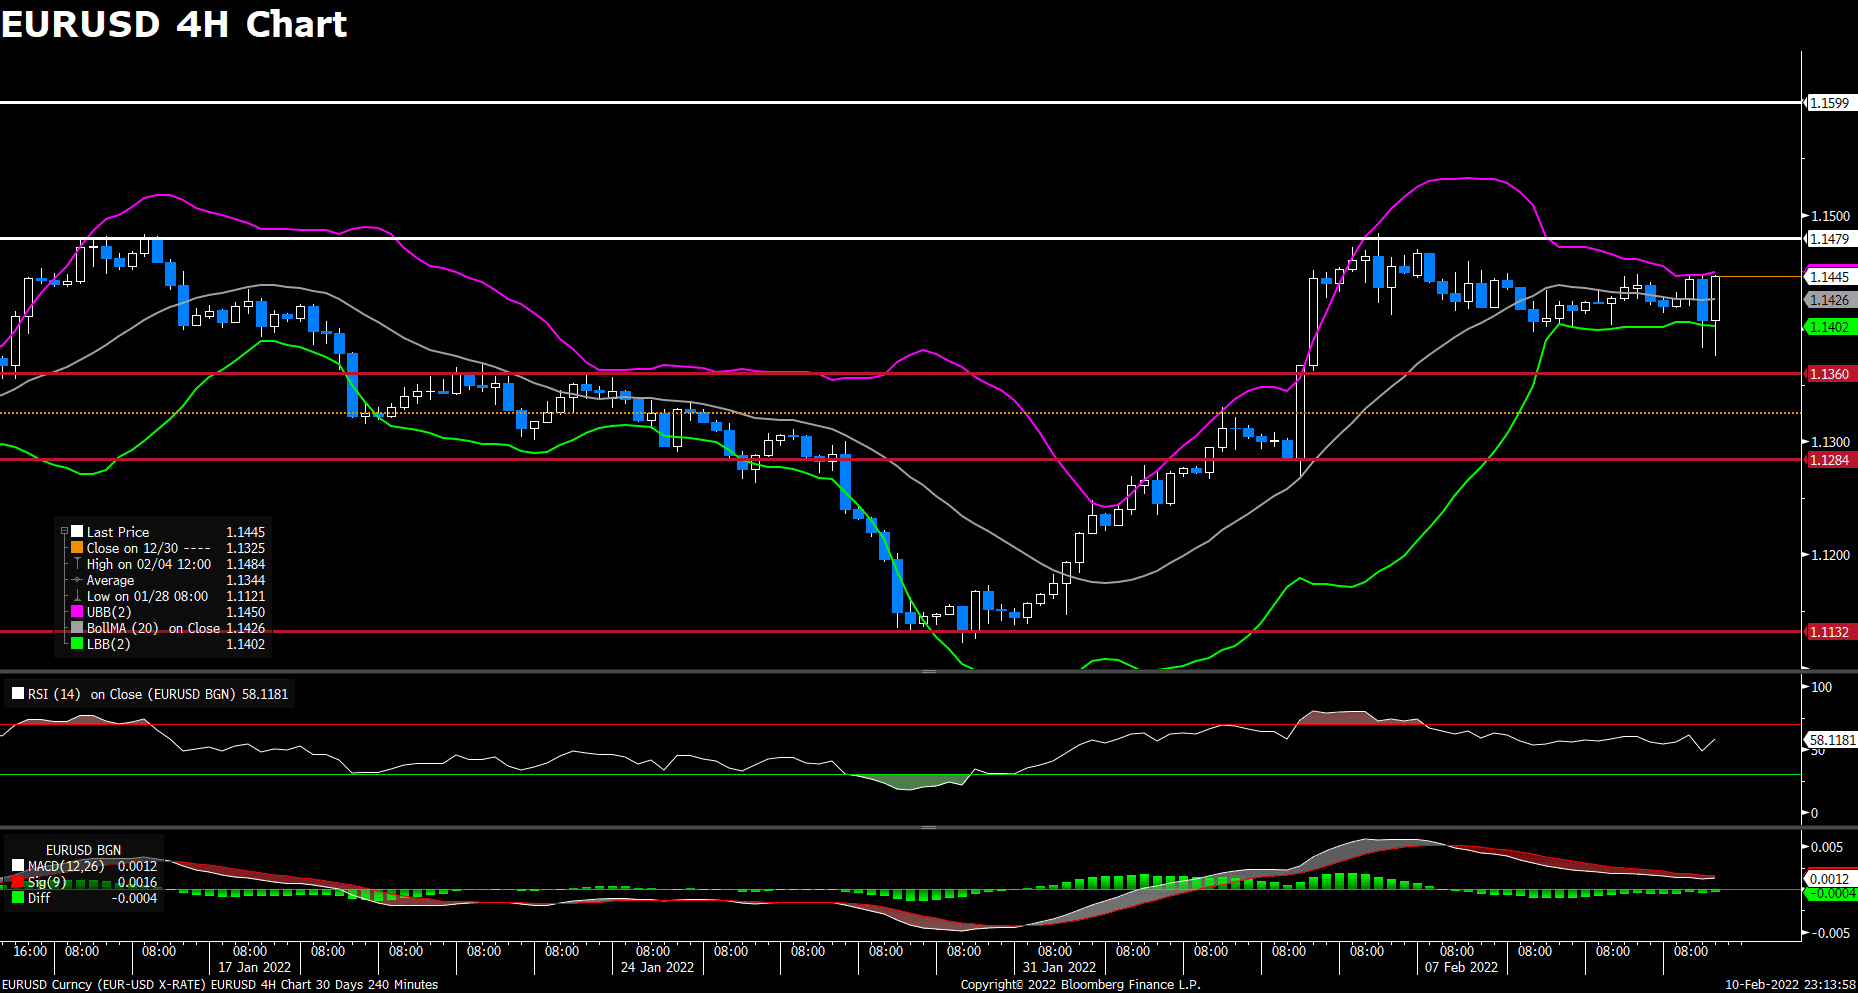
The EUR/USD pair edged higher on Thursday, rebounding back to 1.1440 area amid renewed US dollar weakness. witnessing heavy selling after the release of US CPI data. The pair tumbled to a weekly low near 1.1380 area after the release of US CPI data, but then regain upside tractions to eliminate its daily losses. The pair was last seen trading at 1.1441, posting a 0.19% gain on a daily basis. EUR/USD stays in the negative territory earlier in the session amid surging US dollar, as the higher-than-expected US CPI report lend support to the greenback and US Treasury bond yields. Inflation in the US rose to 7.5% on a yearly basis in January and surpassed the market expectation of 7.3%, reinforcing the expectation of a more aggressive lift-off by the Fed. In Europe, ECB’s Governing Council Joachim Nagel’s hawkish comment yesterday might limit the losses for the EUR/USD pair.
For technical aspect, RSI indicator 56 figures as of writing, suggesting that the upside is more favored as the RSI stays above the midline. As for the Bollinger Bands, the price is rising from the moving average after touching it, which indicates that the pair could remain its upside traction. In conclusion, we think market will be slightly bullish as the pair might re-test the 1.1480 resistance.
Resistance: 1.1480, 1.1600
Support: 1.1360, 1.1284, 1.1132
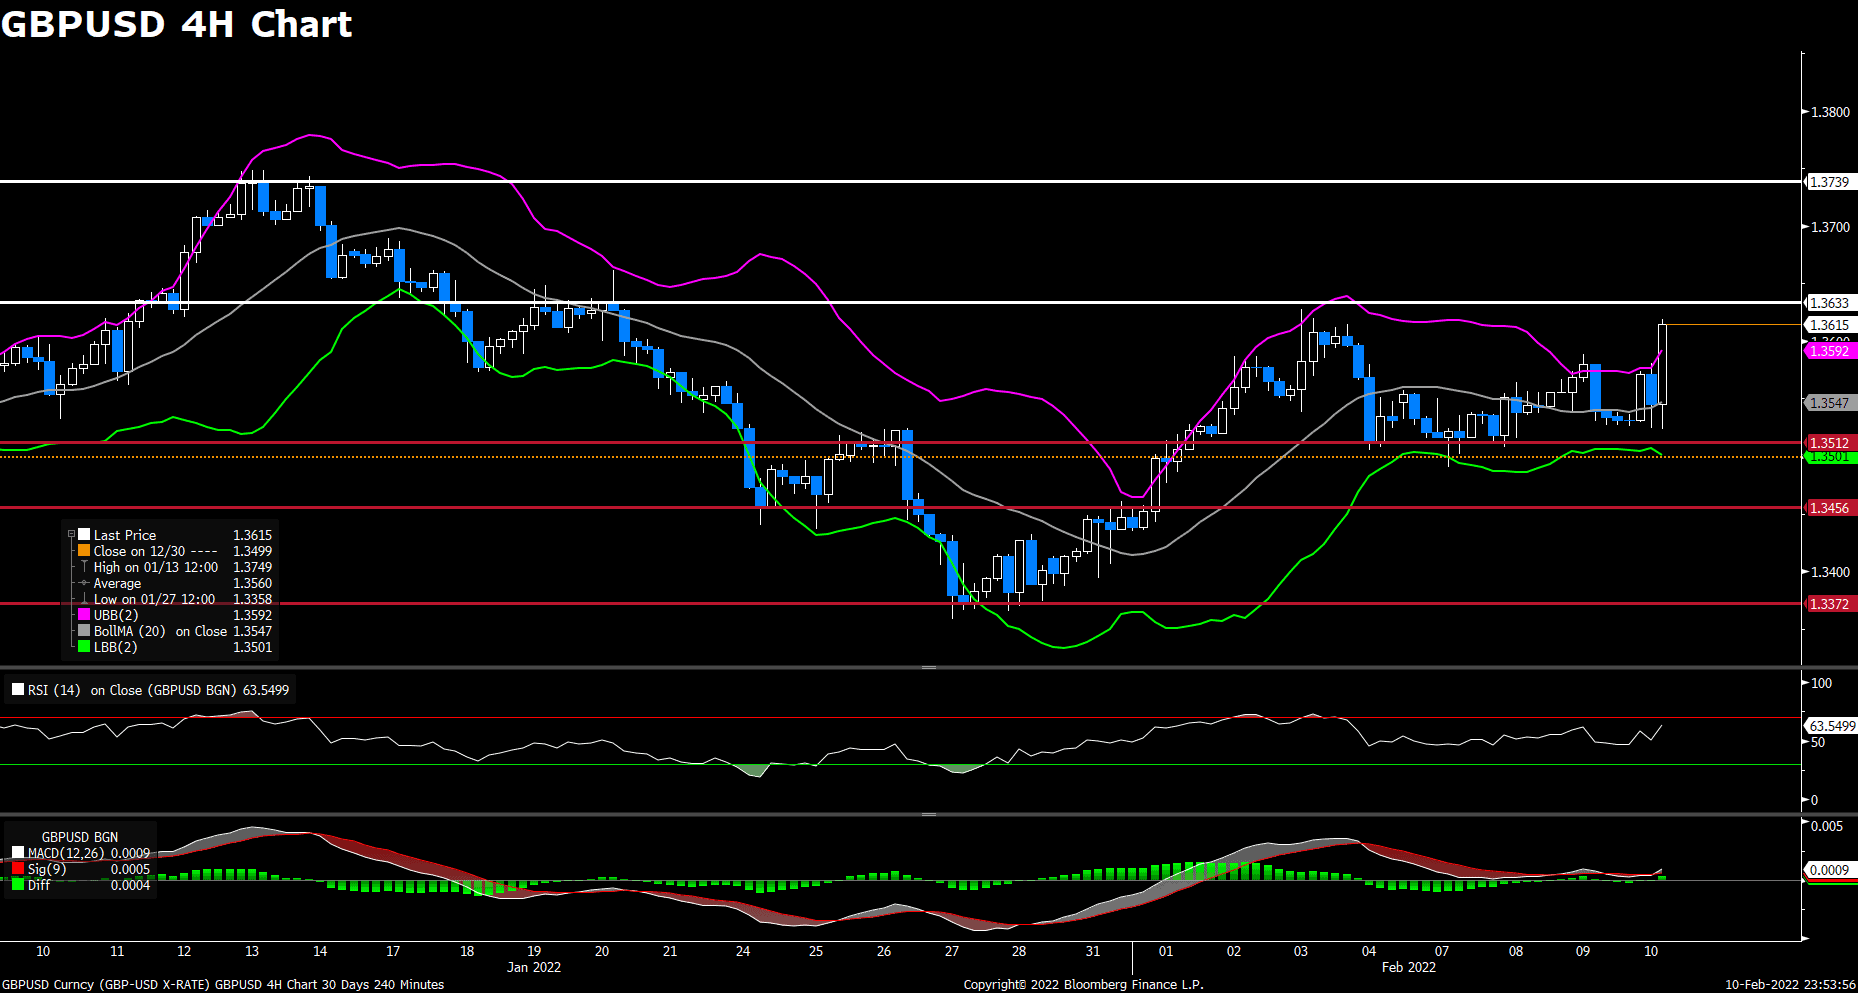
The pair GBP/USD advanced on Thursday, approaching to 1.3600 mark as investors assess higher-than-expected US CPI prints. The pair witnessed a dramatic turnaround in reaction to US inflation data, dropping to a fresh daily low below 1.3530 level before bouncing back. At the time of writing, the cable stays in positive territory with a 0.59% gain for the day, staging a goodish rebound amid renewed US dollar weakness. The higher CPI data from the US reinforced rate hike expectations from the Federal Reserve and triggers volatility across financial markets. On top of that, the cautious comments from Bank of England Chief Economist Huw Pill yesterday might limit the upside for the cable, as well as the renewed tensions over the Northern Ireland Protocol of the Brexit agreement.
For technical aspect, RSI indicator 62 figures as of writing, suggesting bull movement ahead. As for the Bollinger Bands, the price moves out of the upper band, so a strong trend continuation can be expected. In conclusion, we think market will be bullish as the pair is heading to test the 1.3633 resistance line. The near-term bullish bias stays intact as the GBP/USD pair trades above the 200-period SMA on the four-hour chart.
Resistance: 1.3633, 1.3739
Support: 1.3512, 1.3456, 1.3372
USDCAD (4-Hour Chart)
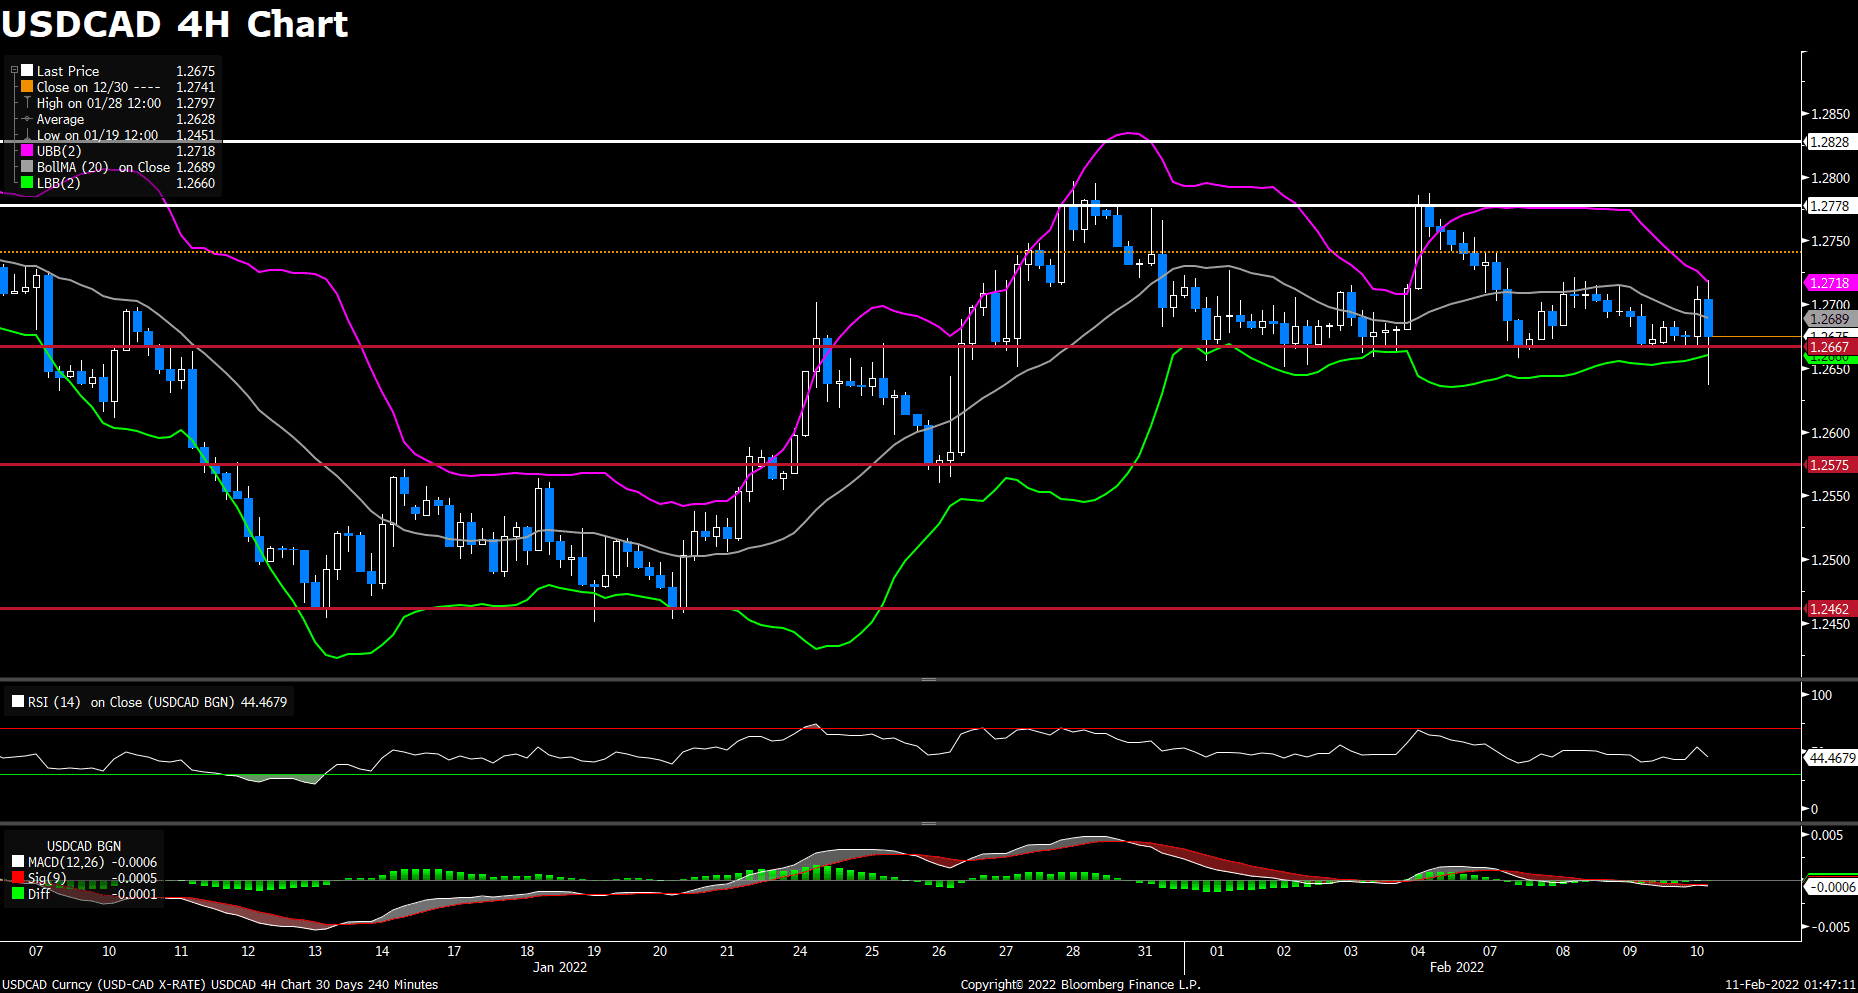
After previous day’s slide to 1.2670 area, the pair USD/CAD regained bullish momentum and refreshed three-day top amid higher-than-expected US CPI data. But the pair has pulled back to surrender most of its intraday’s gain as the renewed US dollar weakness dragged the pair lower. USD/CAD now remains under pressure post-US inflation report, losing 0.01% on a daily basis. However, the expectations that the Fed will announce the plan to begin tightening policy at its March meeting might limit the losses for the greenback and USD/CAD pair. On top of that, surging crude oil prices also acted as a headwind for the pair, as WTI climbs above $91 and posts a 1.36% gain on a daily basis.
For technical aspect, RSI indicator 38 figures as of writing, suggesting that that the downside is more favored as the RSI stays below the midline. As for the Bollinger Bands, the price fell out of the lower band, therefore the downside momentum should persist. In conclusion, we think market will be bearish as the pair has already broken the previous support at 1.2667, therefore additional losses could be expected for the pair.
Resistance: 1.2778, 1.2828
Support: 1.2667, 1.2575, 1.2462
Economic Data:
|
Currency |
Data |
Time (GMT + 8) |
Forecast |
|
|
GBP |
GDP (YoY) (Q4) |
15:00 |
6.4% |
|
|
GBP |
GDP (QoQ) (Q4) |
15:00 |
1.1% |
|
|
GBP |
GDP (MoM) |
15:00 |
||
|
GBP |
Manufacturing Production (MoM) (Dec) |
15:00 |
0.1% |
|
|
GBP |
Monthly GDP 3M/3M Change |
15:00 |
||
|
RUB |
Interest Rate Decision (Feb) |
18:30 |
9.50% |
|
|
USD |
Fed Monetary Policy Report |
23:00 |