Market Focus
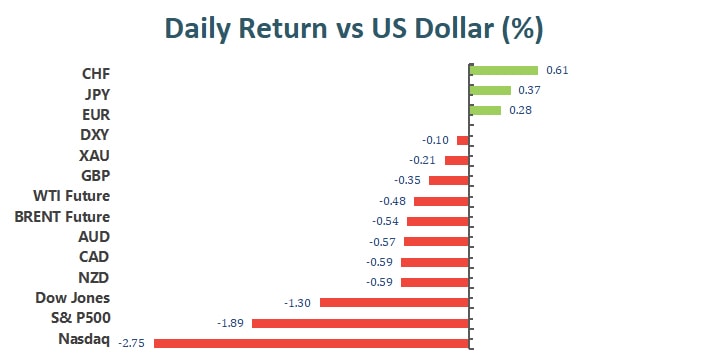
U.S. equity markets continue their losses on the last trading day of the week. The Dow Jones industrial average slid 1.3% to close at 34,265.37, the S&P 500 lost 1.89% to close at 4,397.94, and the Nasdaq lost 2.72% to close at 13,768.92. The Nasdaq was heavily draw down mainly due to fears caused by Netflix and Peleton. The two company’s’ share prices enjoyed healthy gains throughout 2021, as consumers demanded in-home entertainment; however, with people resuming to pre-pandemic entertainment outlets and the Fed reserves’ imminent monetary tightening, these two companies are in desperate need of adjusting their operating strategies as 2022 unfolds. Share price of Netflix has dropped in excess of 23% since the beginning of this trading week.
The benchmark U.S. 10 year treasury yield declined slightly to 1.771%, while the 30 year treasury yield slid to 2.085%.
Looking ahead at next week’s economic docket, Thursday the 27th will be packed with FOMC’s press conference, U.S. quarterly GDP data release, and U.S. initial jobless claim figures. These three events shall have great impact on how markets will close out the first month of 2022.
Main Pairs Movement:
With U.S. treasury yields receding, the Dollar index faltered as well. The DXY closed 0.14% lower after Friday’s trading but was still able to close the week with a 0.67% gain against a basket of major foreign currencies.
Cable slid 0.33% over the course of Friday’s trading. Weaker than expected retail sales figures from the U.K. sent Sterling tumbling against the Greenback. With FOMC’s press conference nearing, Cable faces strong downward pressure.
The Euro gained 0.3% against the Greenback on Friday. The Greenback’s across the board weakness allowed the Euro to recoup some of its intra-week losses.
Gold lost 0.26% on Friday but ended the week with a solid near 1% gain. The precious metal continues to embody positive sentiment as inflationary pressure around the world continue to rise.
Technical Analysis:
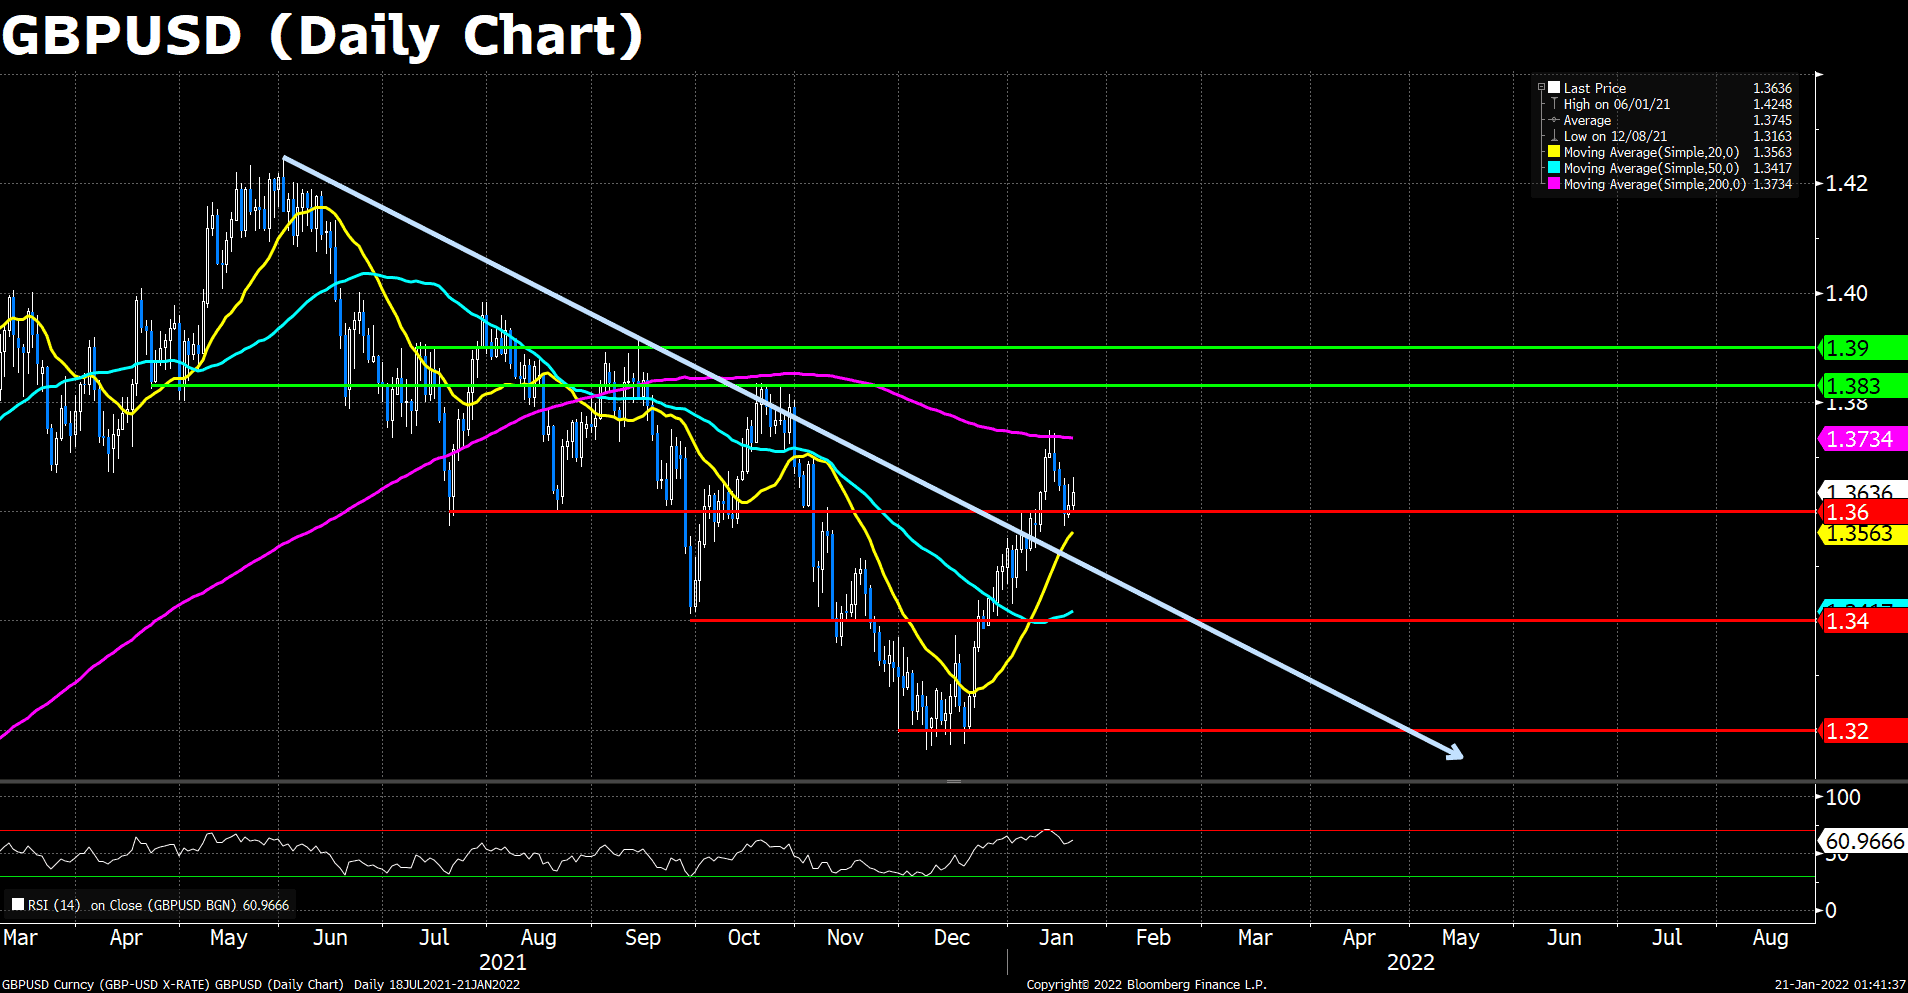
GBP/USD broke out to fresh weekly lows on Friday and has continued to press lower as the US trading session has gotten underway, with sterling succumbing to weak data and risk-off flows that are weighing broadly on risk-sensitive currencies. Data released by the UK’s ONS on Friday showed that headline Retail Sales dropped 3.7% MoM, much larger than expectations for a 0.6% MoM decline. At current levels just above the 1.3550 mark, GBP/USD now trades about 0.3% lower on the day, taking on the week losses to about 0.9%.
On the technical front, with the latest drop having taken the pair back below the 20 DMA for the first time since this time last month, the sterling bulls will be concerned that GBP’s near-term momentum has turned negative. The main area of support for cable traders to now keep an eye on is at the 1.3500 level, as a breach of that level incicates that the pair get back to its past downtrend. The RSI for Cable dropped drastically, from its 60s to around the average line.
Resistance: 1.3733 (200 DMA), 1.3830, 1.3900
Support: 1.3600, 1.3400, 1.3200
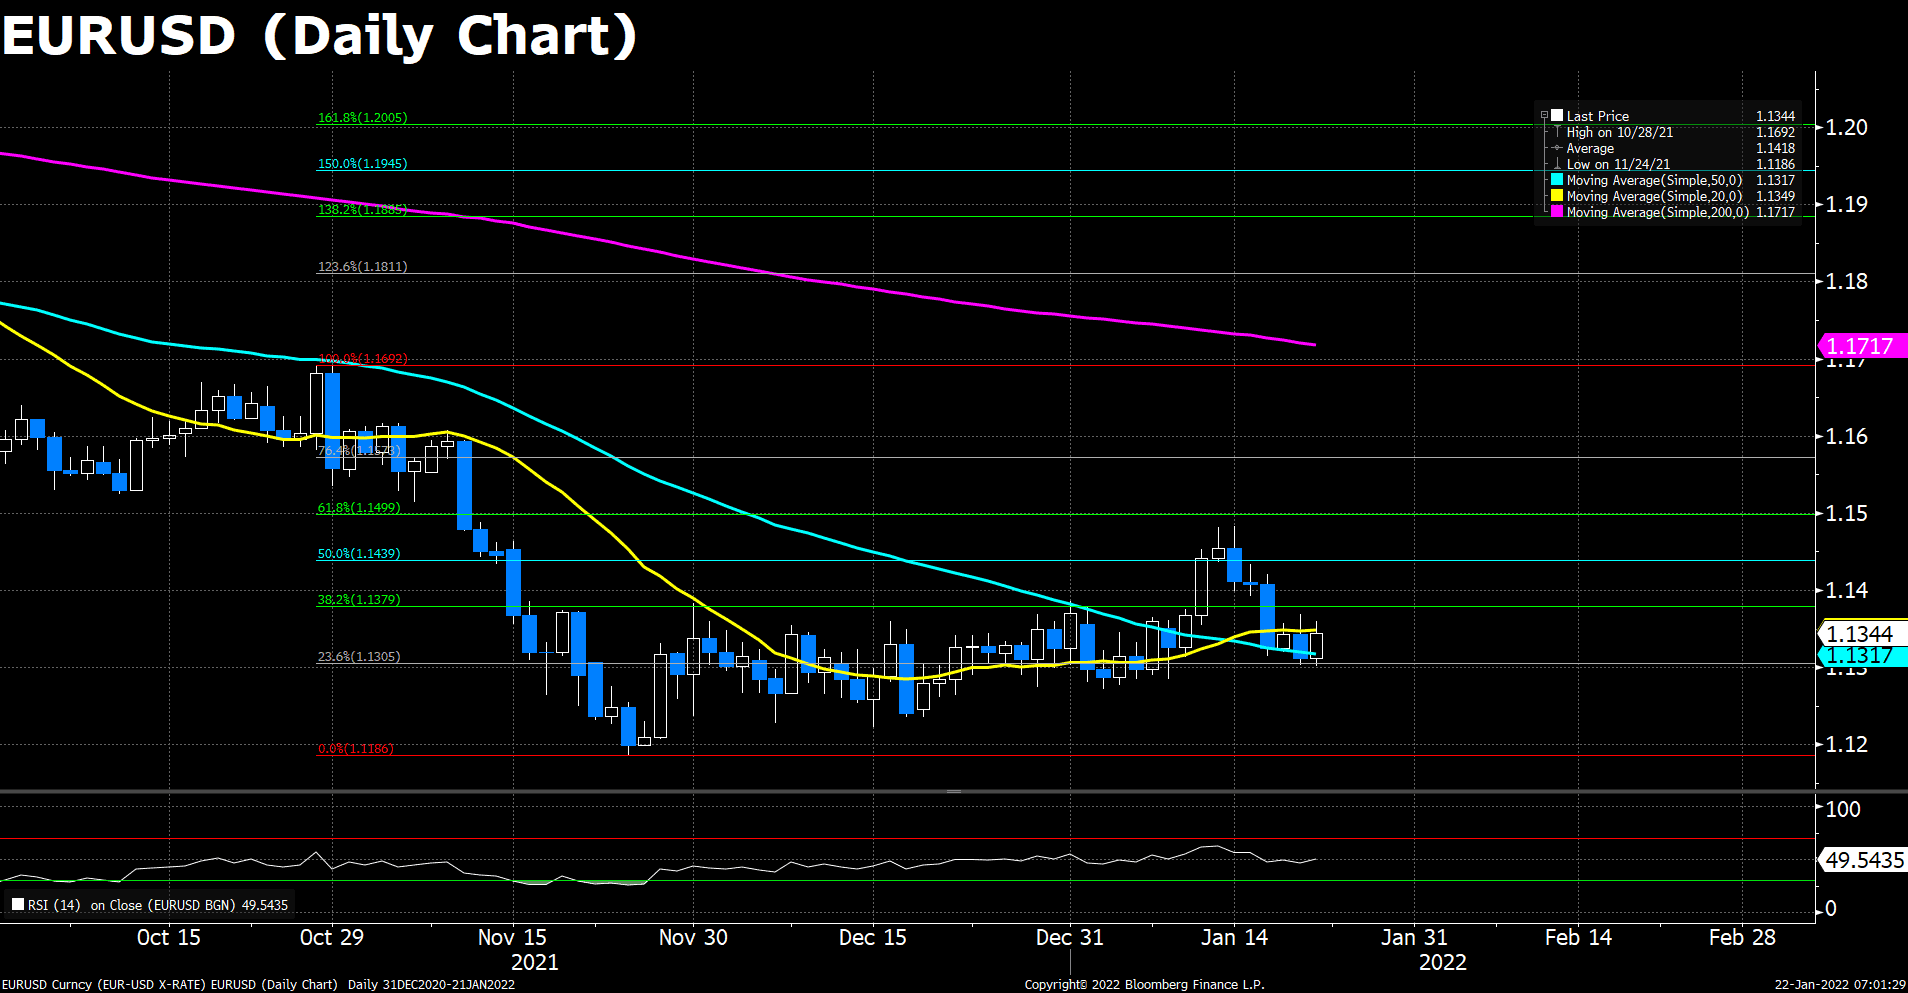
The Euro pair is rising on Friday, and after the beginning of the American session, it peaked at 1.1361 and then pulled back. The US dollar is posting mixed results across the board, ahead of the weekend.
The upside lost momentum amid risk aversion. Equity prices in Wall Street are falling again, with the Dow Jones losing 1.30% and the Nasdaq 1.89%. The negative tone is boosting Treasuries. The 10-year yield stands at 1.762%, while the 30-year 2.076 both a one-week lows.
As to technical, the shared currency’s price action is back into the previous consolidation range seesawing around the 23.6% Fibonacci. The RSI indicator reads 49.54, showing no obvious traction from either side. If the pair manages to rise back above 38.2% Fibonacci the outlook would improve. On the downside, a solid break under 23.6% Fibonacci should clear the way to more losses and to a test of the bottom of the retracement lines.
Resistance: 1.1380, 1.1440,1.1500
Support: 1.1300, 1.1200
XAUUSD (Daily Chart)
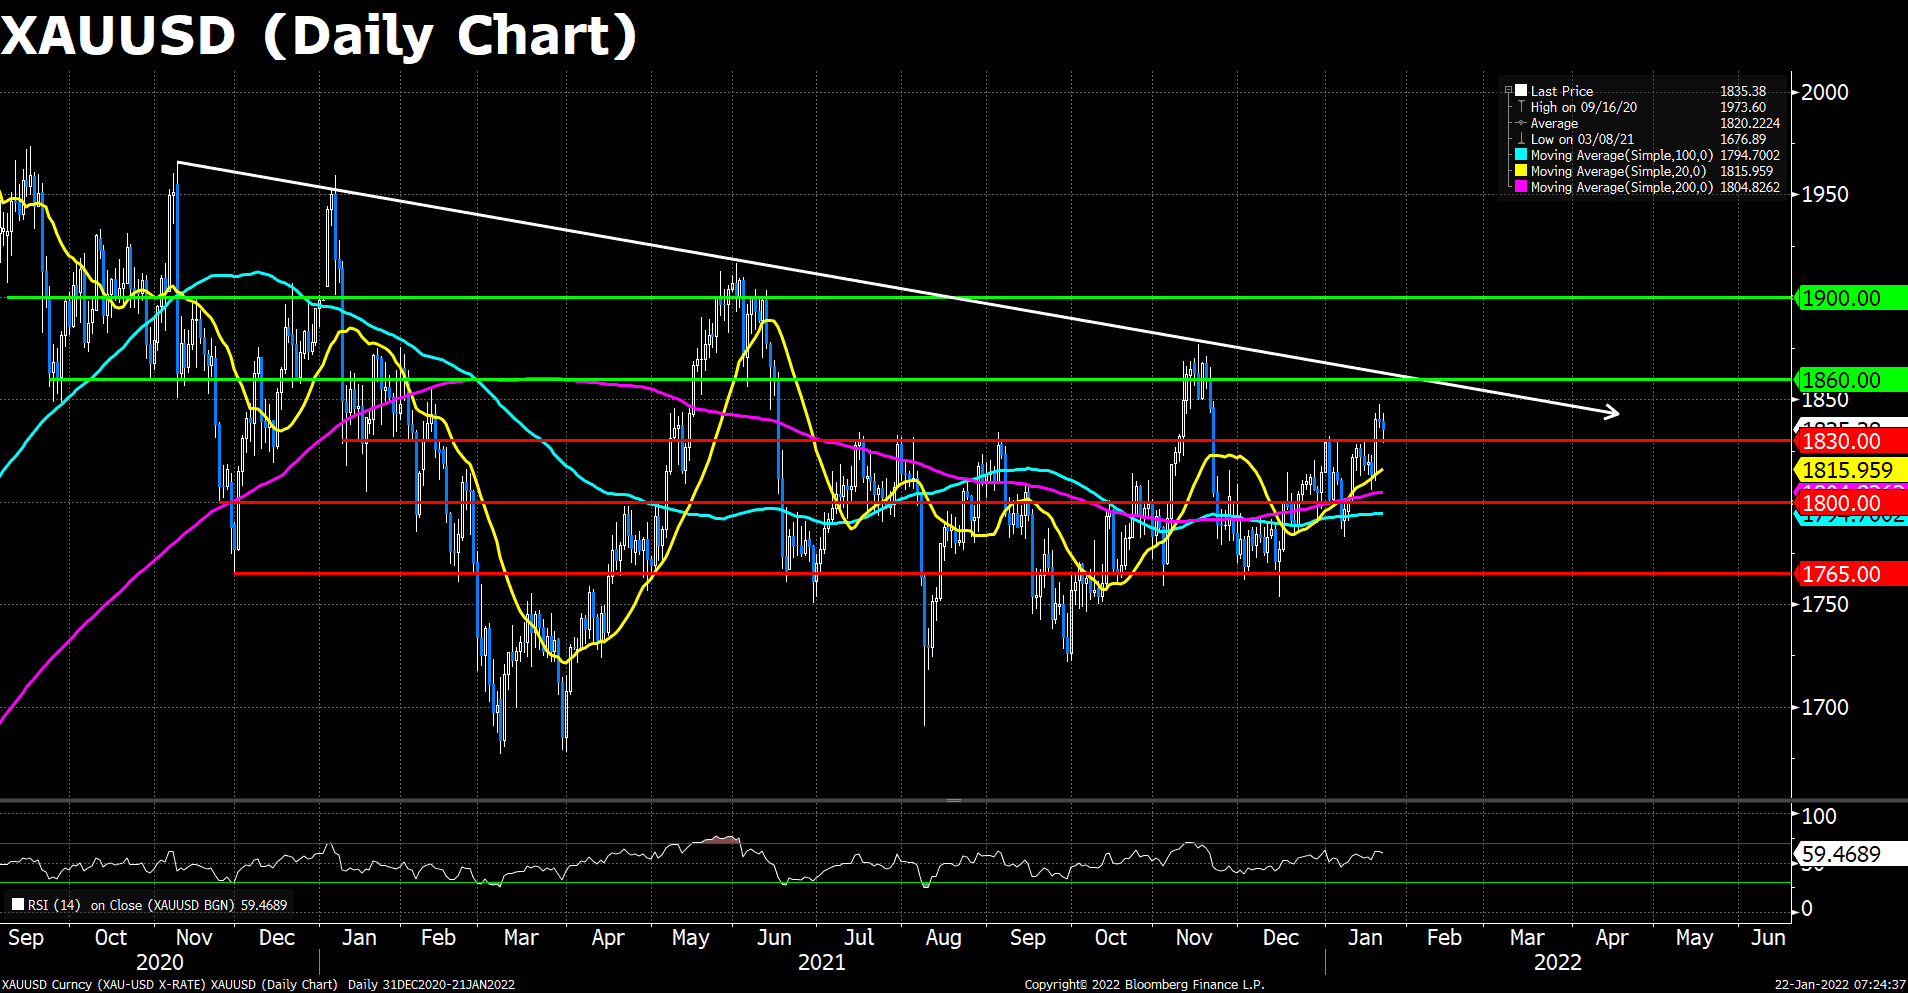
Gold price slid a bit to the south during today’s trading, closing the week at $1,835 a troy ounce which is the second straight week ended in positive territory. The ongoing conflict between Russia and Ukraine, the People’s Bank of China’s efforts to loosen their policy amid worsening economic outlook and the steep drop seen in Wall Street are the main drivers for gold’s recent rally. However, on Wednesday, the Fed will announce its policy rate decision and release the Monetary Policy Statement following its two-day meeting. A decision to increase the reductions in monthly asset purchases or 50 bps rate hike in March or worse, both, could weigh hugely on the demand of the bright metal.
From the technical perspective, the RSI bias remain above the average line, after breaking the $1830 area on Wednesday. Since the next resistance lies $25 above the current price level, there’s still room for the gold’s traction. As previously mentioned, we expect the short-term uptrend to reach the critical $1,860 resistance, though the downside risk will gradually increase during its climb.
Resistance: 1860, 1900
Support: 1830, 1800, 1765
Economic Data:
|
Currency |
Data |
Time (GMT + 8) |
Forecast |
|
|
EUR |
German Manufacturing PMI (Jan) |
16:30 |
57.0 |
|
|
GBP |
Composite PMI |
17:00 |
||
|
GBP |
Manufacturing PMI |
17:00 |
||
|
GBP |
Services PMI |
17:00 |
||