Market Focus
US equities advanced on Friday after a mixed session in the markets, with both earnings and inflation data remaining at the investor’s focus. The S&P 500 posted gains, and both the Dow and Nasdaq also closed out Friday’s session in the green after a volatile trading week. Johnson & Johnson (JNJ) rose after the company said it was planning to split into two separate companies focused on consumer health products and pharmaceuticals, respectively, in a move echoing a similar breakup announcement by General Electric (GE) earlier this week.

Federal Reserve Bank of Minneapolis President Neel Kashkari said the U.S. central bank shouldn’t overreact to elevated inflation even as it causes pain for Americans, because it is likely to prove temporary.
“The high prices that families are paying, those are real and people are experiencing that pain right now,” Kashkari said Sunday on CBS’ “Face the Nation.”
“We need to take it very seriously, but my view is we also need to not overreact to some of these temporary factors even though the pain is real,” he said.
The consumer price index increased 6.2% in the 12 months through October, the fastest annual pace since 1990, according to Labor Department data released last week. That has increased the pressure on the Fed from some economists to accelerate its withdrawal of support for the U.S. economy.
Former Treasury Secretary Lawrence Summers, speaking Sunday on CNN’s “Fareed Zakaria GPS,” said inflation’s momentum has built up to a point where “it’s going to take some significant policy adjustment or some unfortunate accident that slows the economy before inflation gets back to the 2% range.”
Fed policy makers announced November 3rd that they had agreed to begin reducing monthly bond purchases designed to boost the economy by suppressing borrowing costs. They left their benchmark interest rate in a range between zero and 0.25%.

Main Pairs Movement:
The US dollar lost its strength against most of its major rivals during Friday’s trading hours. The dollar index hovered around a tight range just above 95.00, with losers on Thursday taking back their lost lands, and the shared currency being the worst performer as the selling pressure are still strong amid a dovish ECB.
The Euro pair continues to drill to its yearly low, pinned 1.1433 and ending the day 10 pips above it. Cable recovered all of its losses on Thursday after a 50-pip surge, closing the week at 1.3412. Loonie bounced off 1.2600 at the early London hours, but then failed to fuel the uptrend and fell to 1.2550 at the end of the day. Aussie, however, posted gains against the greenback, up 0.6% and now trades at 0.7330, while Ninja lost ground on Friday, closing the day at 113.85.
Gold’s demand remains robust amid a weeklong gaining streak. Spot trades above $1,867 a troy ounce, a price last seen in June. Crude oil prices underwent a mild loss, with WTI ending the day red at $80.80 a barrel, and Brent down to $81.95.
Technical Analysis:

Following previous two-day slide to a yearly low, the pair GBP/USD rebounded moderately on Friday. The pair was pushed higher to daily top in early European session, then started to see some selling and pared part of its intraday gains. However, the pair still stays in positive territory amid US dollar weakness, rising 0.36% on a daily basis. British Pound is the best performing G10 currency so far today, as news reported that the UK wants to de-escalate Brexit-related tensions with the EU and they don’t want to trigger Article 16 of the Northern Ireland Protocol. But the Bank of England’s dovish decision last week might continue to cap the upside for the cable.
For technical aspect, RSI indicator 40 figures as of writing, suggesting bear movement ahead. But for the MACD indicator, a golden cross is forming on the histogram, which indicates an upward trend for the pair. Looking at the Bollinger Bands, the price rose from the lower band and now it’s moving towards the moving average. Therefore the pair will experience some bullish momentum since prices have a tendency to bounce within the bands’ envelope. In conclusion, we think market will be bullish as long as the 1.3355 support line holds.
Resistance: 1.3607, 1.3698, 1.3835
Support: 1.3355, 1.3188

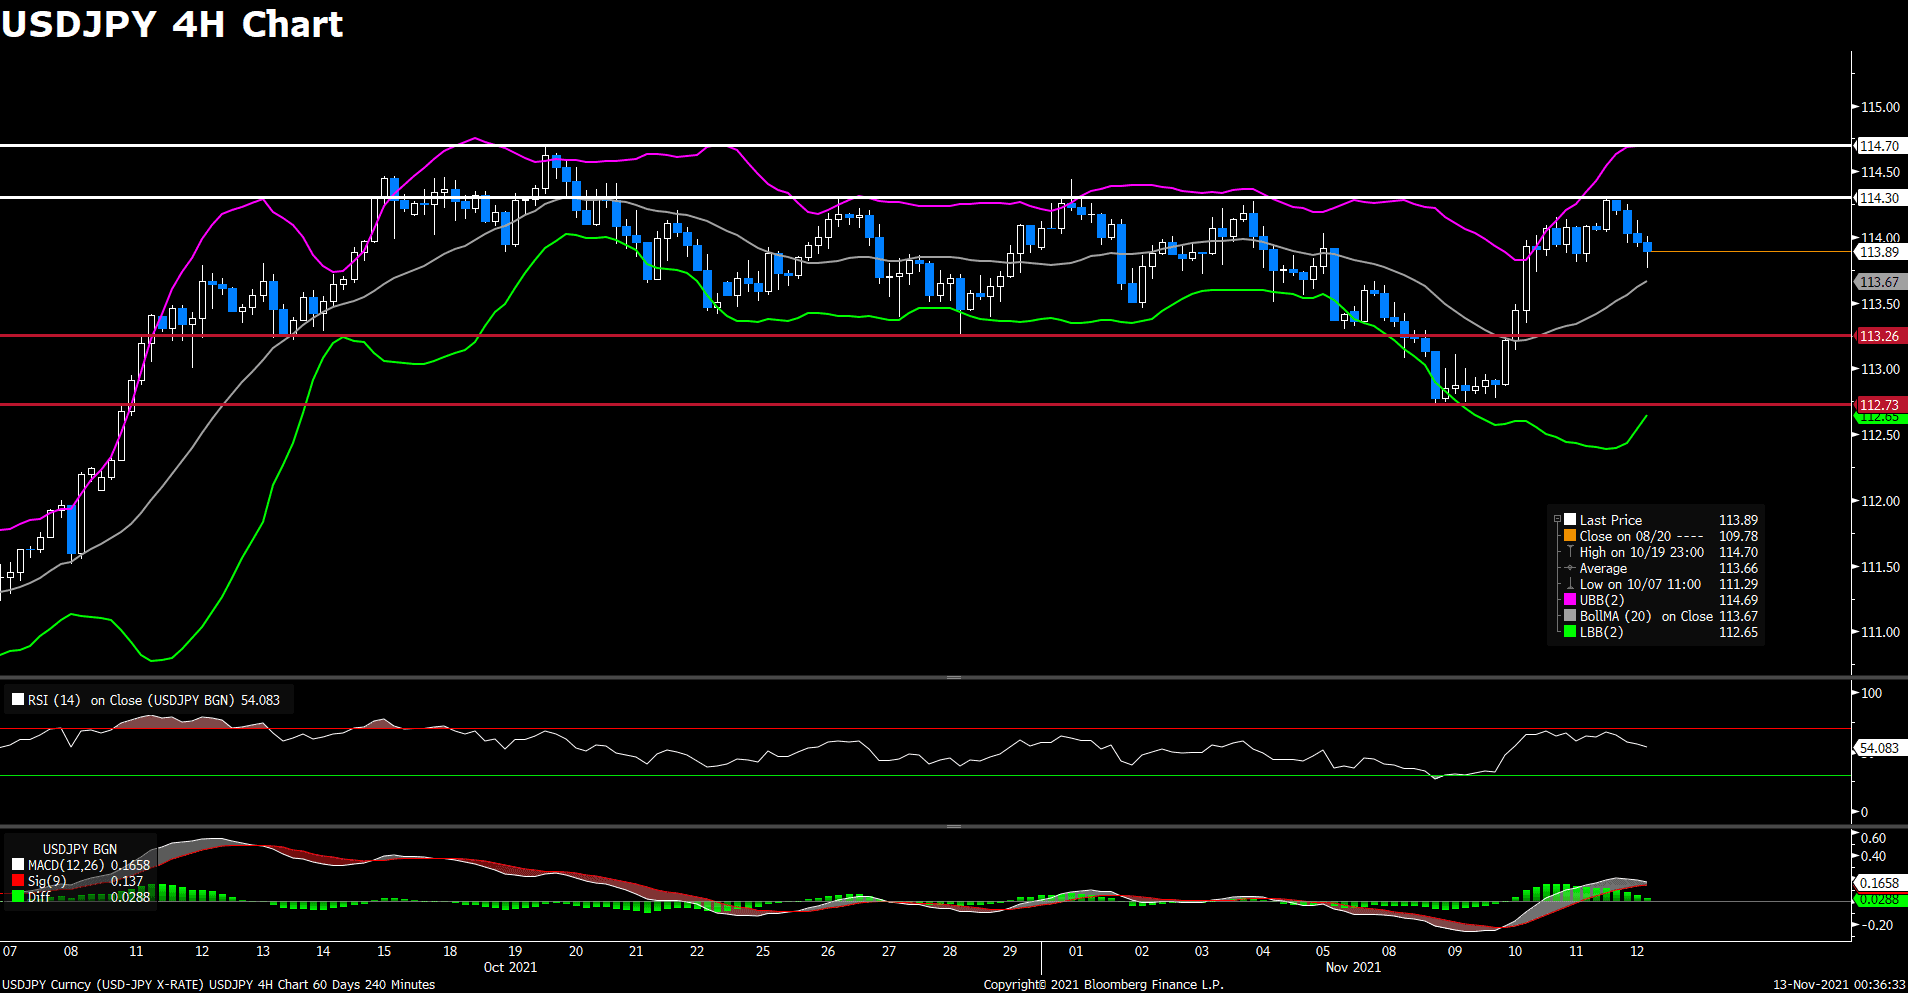
The pair USD/JPY declined on Friday, pulling back from a two-week high above 114.25 level. The pair supported by US dollar strength in early Asian session, but failed to keep its bullish traction and dropped further during American trading hours. USD/JPY has slightly rebounded from a daily low, currently losing 0.14% on a daily basis. The risk-off sentiment around the equity markets and lower US Treasury bond yields both underpinned the safe-haven Japanese yen, but expectations about an early policy tightening by the Fed after an upbeat US CPI reports should lend some support to the greenback and limit the losses for USD/JPY pair.
For technical aspect, RSI indicator 54 figures as of writing, suggesting tepid bull movement ahead. But looking at the MACD indicator, the positive histogram starts to diminish which indicates a possible downward trend for the pair. As for the Bollinger Bands, the negative tone should be intensified if the pair drop below the moving average. In conclusion, we think market will be bearish as long as the 114.30 resistance line holds, and if the pair slip below the 113.26 support, a test of the monthly lows seems likely.
Resistance: 114.30, 114.70

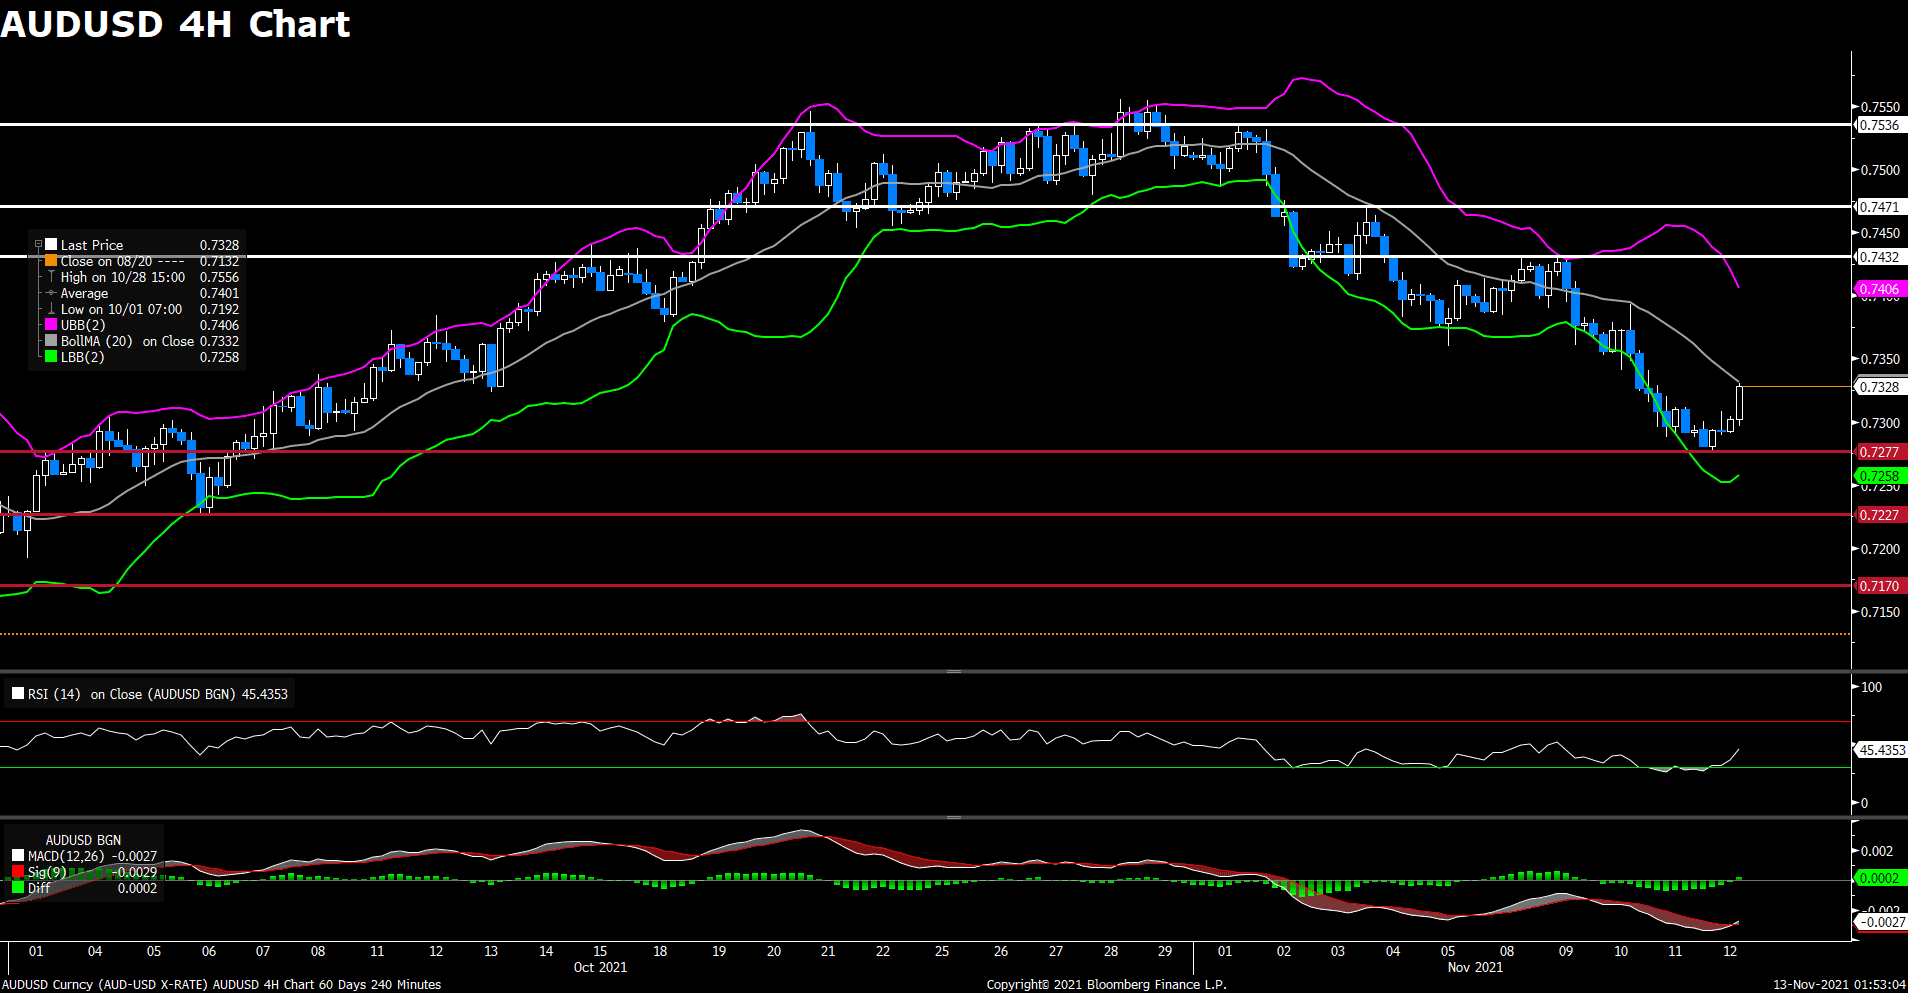
The pair AUD/USD rebounded on Friday, ending its three-day slide amid weaker US dollar across the board. The pair saw some selling in early Asian session but then was able to find demand later, posting a 0.55% gain for the day. The University of Michigan Consumer Sentiment Index for November declined to 66.8, marking the lowest reading since November 2011. Concerns about surging inflation resulted in the dismal data, which dragged the greenback under 95.1 area. On top of that, downbeat Australian jobs report and rising unemployment rate might limit any meaningful gains for the AUD/USD pair.
For technical aspect, RSI indicator 45 figures as of writing, suggesting tepid bear movement ahead. But looking at the MACD indicator, a golden cross is shown on the histogram, which indicates a upward trend for the pair. As for the Bollinger Bands, the price moved alongside the lower band first and then rebounded toward the moving average, which could be a buying signal for the pair. In conclusion, we think market will be bullish as the pair is eyeing a test of the 0.7432 resistance.
Resistance: 0.7432, 0.7471, 0.7536
Support: 0.7277, 0.7227, 0.7170
Economic Data
|
Currency |
Data |
Time (GMT + 8) |
Forecast |
||||
|
JPY |
GDP (QoQ) (Q3) |
07:50 |
-0.2% |
||||
|
CNY |
Industrial Production (YoY) (Oct) |
10:00 |
3.0% |
||||