


Daily market analysis
May 6, 2021
Daily Market Analysis
Market Focus
Stocks almost wiped out their gains as technology shares turned lower, offsetting optimism over solid corporate earnings and economic reports. Treasuries climbed.
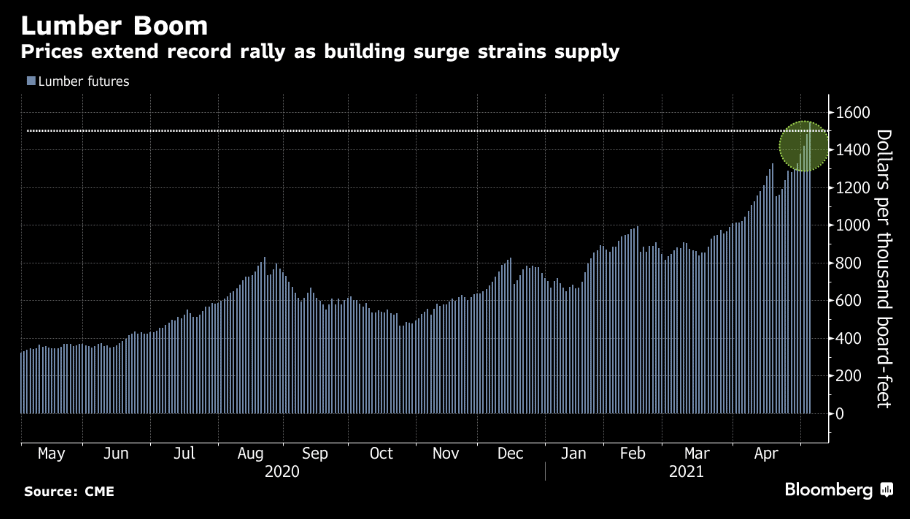
The S&P 500 notched an advance of less than 0.1% while the Nasdaq 100 ended in the red. The Dow Jones Industrial Average rose to a fresh record. Moderna and Johnson & Johnson retreated, while Pfizer finished little changed on news the U.S. will support a proposal to waive intellectual-property protections for Covid-19 shots. Peloton tumbled after recalling its treadmill products. Copper and lumber rallied, adding to inflation worries.
As the world’s largest economy rebounds, an intense debate has emerged over whether actual price pressures are set to materialize. The five-year breakeven rate — a proxy for the annual inflation rate bond traders expect over the span — jumped to the highest since 2008. Despite the increase in commodity prices and supply shortages, several Fed officials said Wednesday that inflation is unlikely to get out of control.
Main Pairs Movement:
The New Zealand and Australian dollars outperformed Group-of-10 currency peers Wednesday as copper surged and a key gauge of commodities rose to the highest since 2015. The dollar was steady, while volatility in the pound hit the highest since March ahead of a Bank of England policy decision due Thursday.
Among G-10 peers, Kiwi led with gains of 0.9%; the Aussie and loonie rounded out the top three, with the latter jumping to the highest since 2018 before paring gains as oil dropped; the Norwegian krone lagged all. Rising commodities are contributing to more bullish sentiment on inflation, with the 5-year breakeven rate hitting the highest since 2008.
GBP/USD rises 0.2% to 1.3908; pared gains after rising as much as 0.3%. One-week volatility in the pound rose to 8.32 vols, highest since late March; Scottish independence vote also fueling higher vols. Elsewhere, gold was struggling in the day and set it below 1790 level, spiral in an accommodative choppy scope between 1764.5 to 1795.

Technical Analysis:
EURUSD (4 hour Chart)
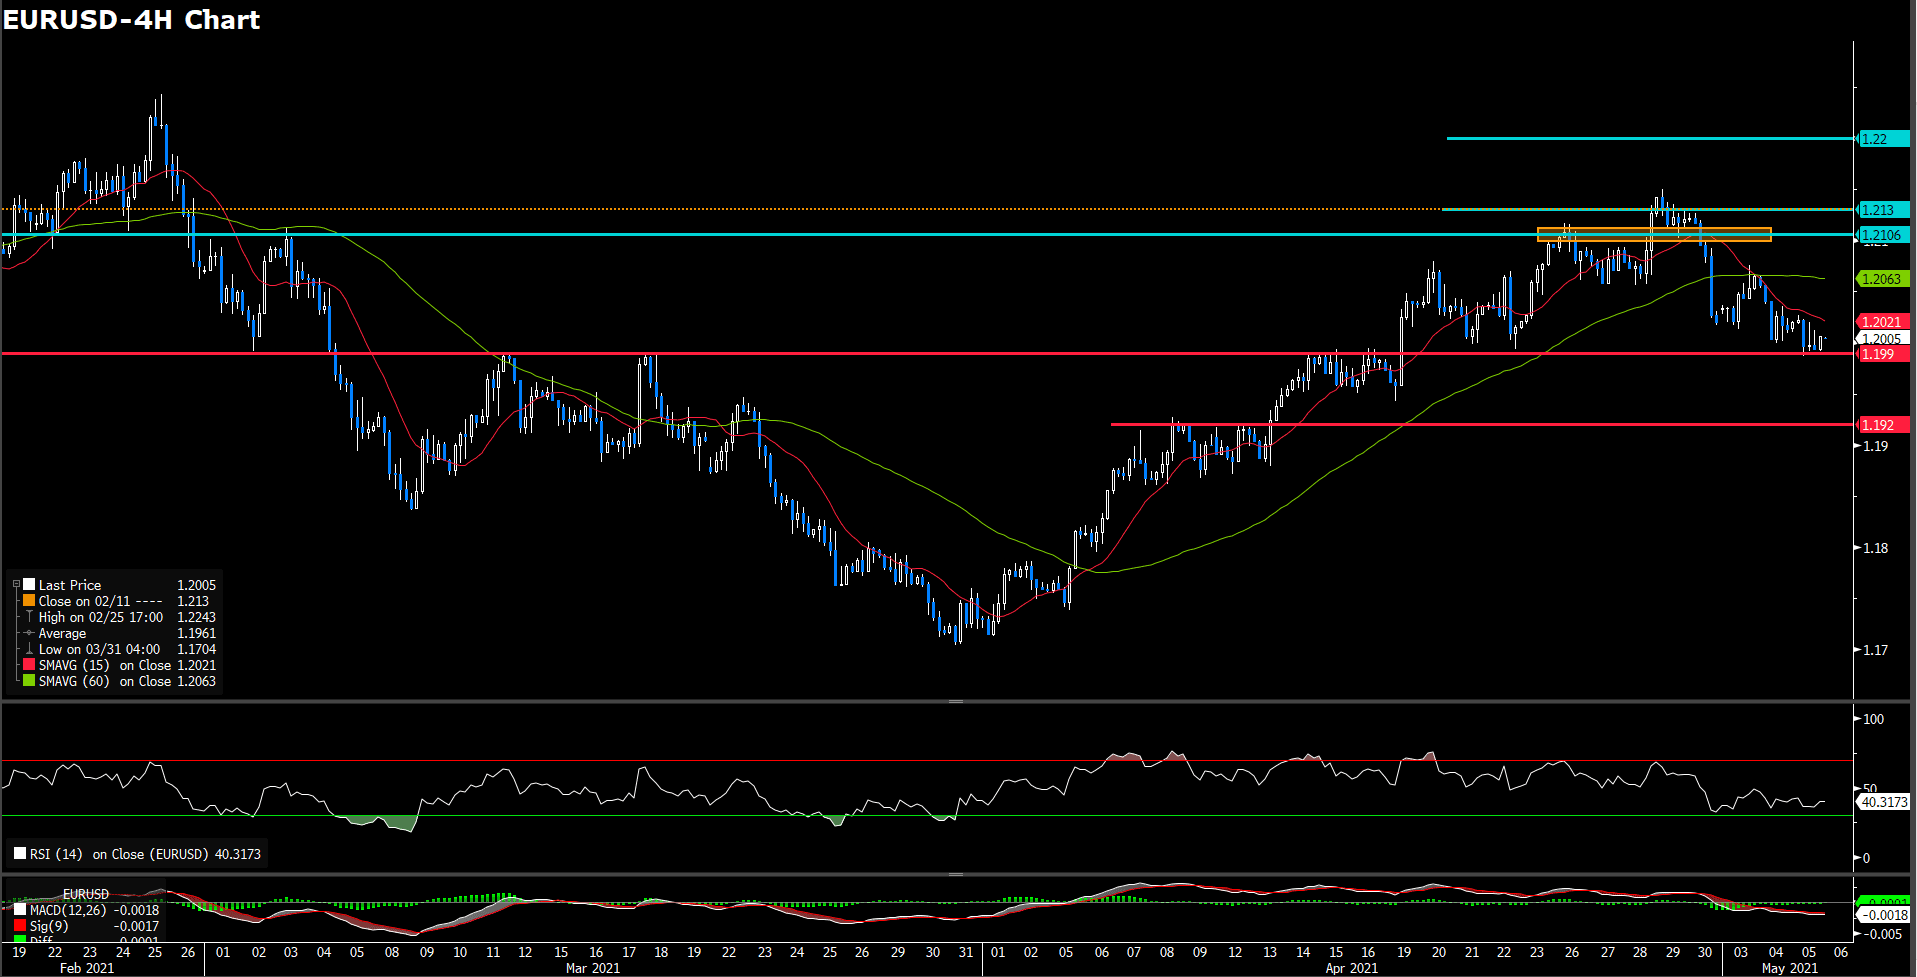
Euro dollar remains on lost traction to close the consecutive 2 day in negative, trading at 1.2003 around. The pair once dropped to its lowest level in more than two weeks at 1.1986 in the European session and seems found a support at 1.19~1.2 level. All of all, recently, the U.S. market continues to drive euro fiber movements while Europe lack of significant news catalyst. For technical aspect, RSI indicator shows 40 figures, suggesting a bearish momentum at least for short term. On average price view, 15-long SMA is maintaining a negative slope and 60-long SMA turned it slope to teeny-tiny downside intraday market.
We foresee market will continue whipsaw or choppy in a range between first support and resistance as it tamp down from 1.213 which was a top pattern in recently. On slid side, we see 1.199 to 1.2 has a strong support level which form by multi-month-long price cluster area where also a neckline for last bottom pattern. If market extend it downside traction, next support will eyes on 1.19-1.192 around.
Resistance: 1.2105, 1.213, 1.22
Support: 1.199, 1.19
USDJPY (4 Hour Chart)
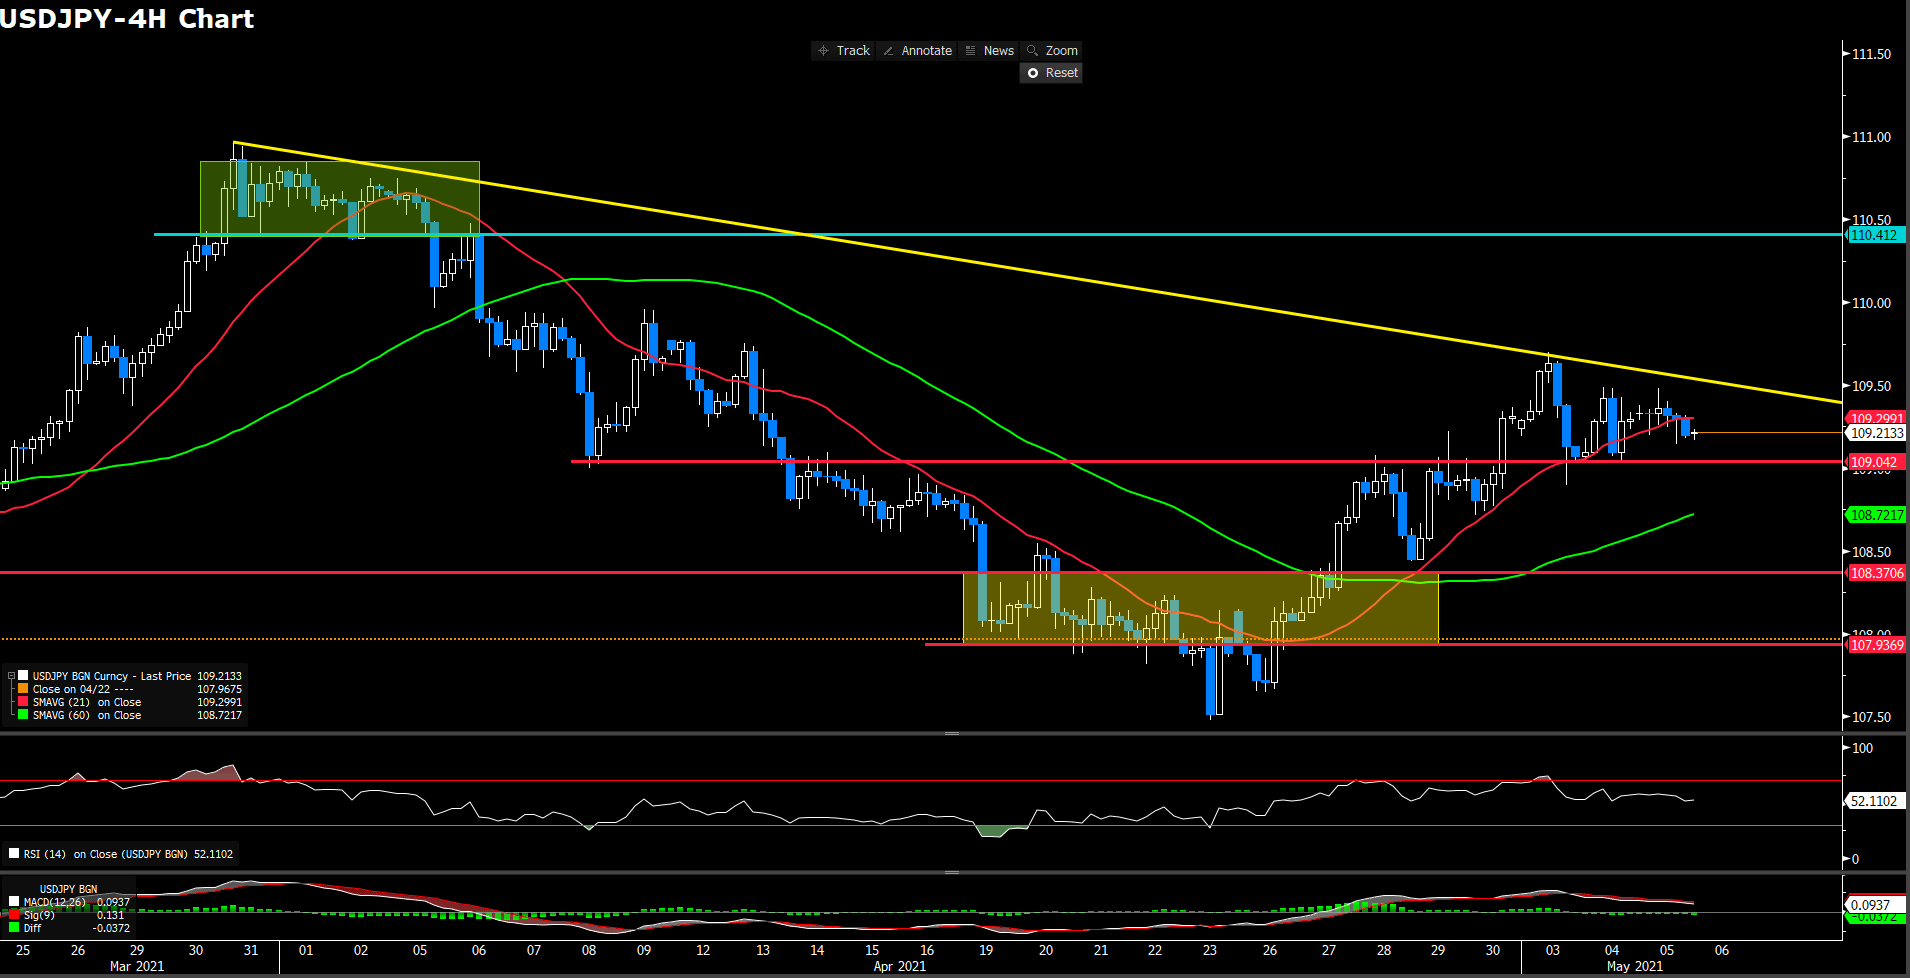
Japan yen fell toward to psychological level at 109 stage after it fail to keep upward momentum above 109.45 that left the door open to a retreat when materialized amid a decline across the board of U.S. dollar. During the American session, it printed a fresh daily low at 109.13. As of writing, it trading at 109.198. For RSI side, indicator shows 52 figures which suggest neutral market sentiment. On the other hands, 15 and 60-long SMAs indicator are retaining it ascending movement notwithstanding 15-long one seems to lose accelerating traction.
We expect 109 still be a powerful support level as yen has successfully denfended in recent days. If yen could consecutive stand above first support level, we believe it could been deemed as a bull movement ahead. For upward favour, 109 level is immediately need to be defend naturally and 108.37 following. Its worth nothing that there has a downside resistance form above current stage as the yellow line. If yen could breakthrough the downside resistance, we see bullish momentum is upcoming.
Resistance: 110.412
Support: 109, 108.37, 107.936
USDCAD (Daily Chart)
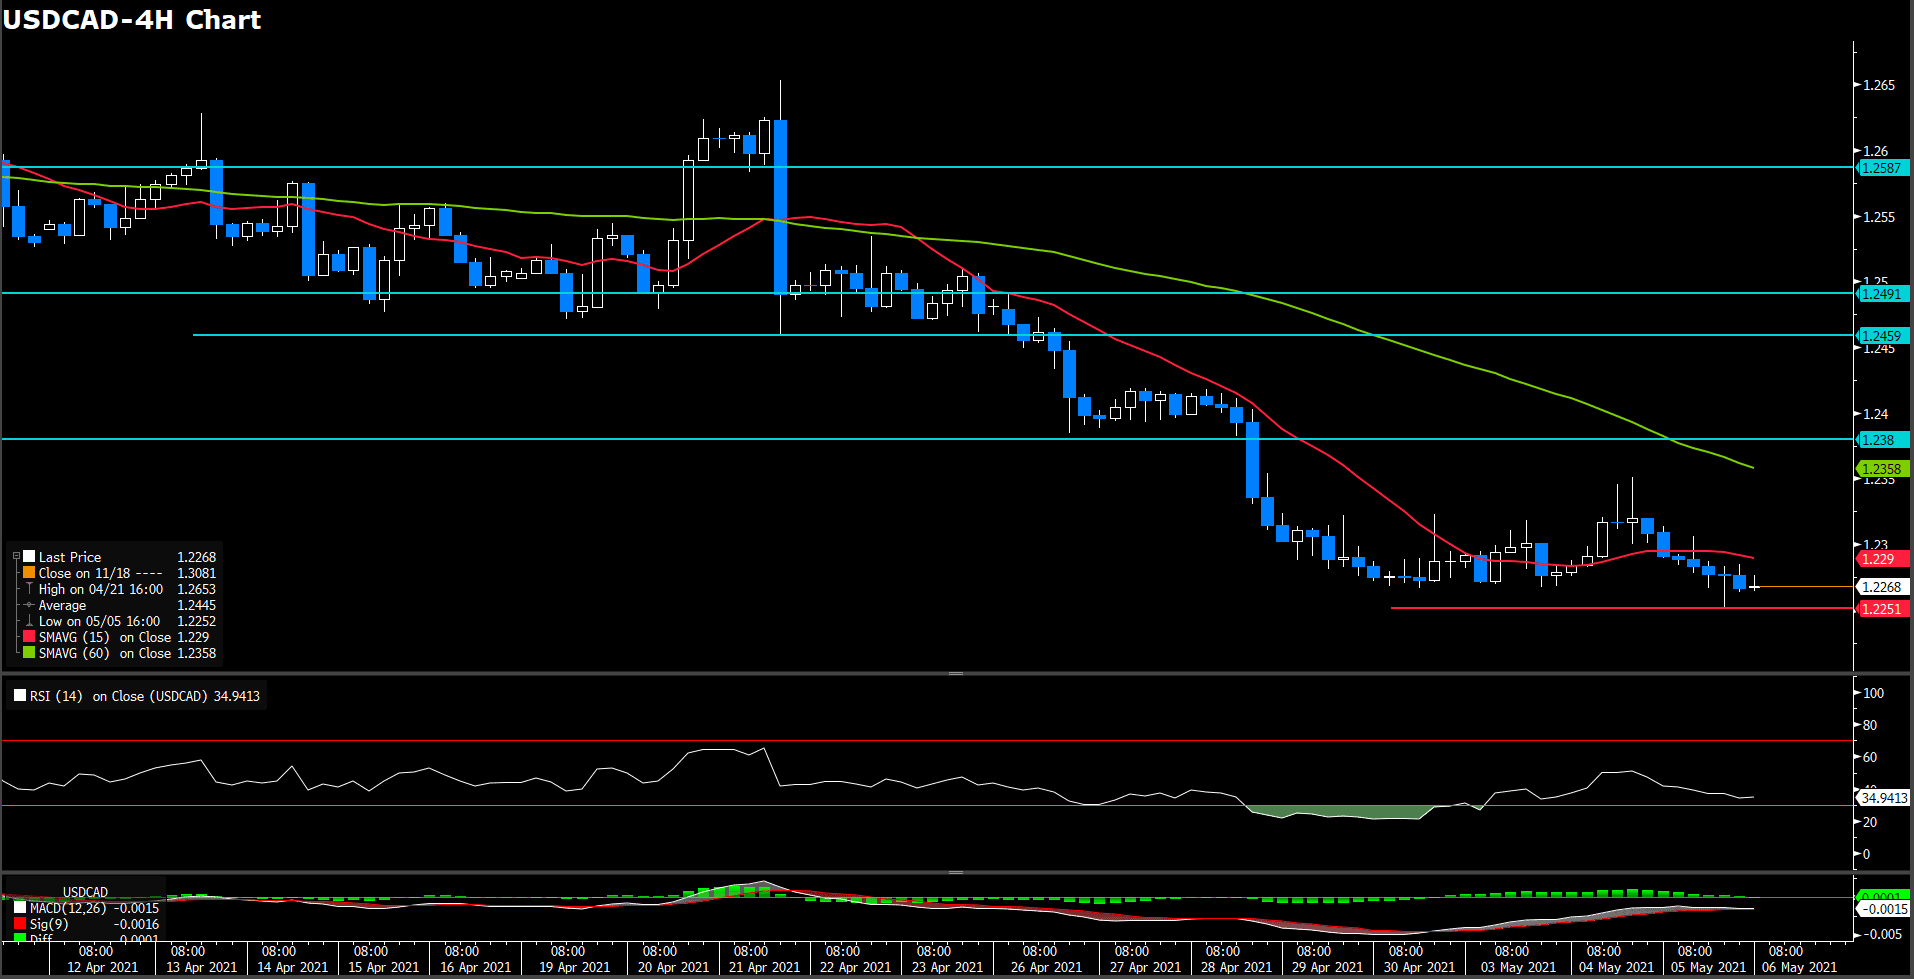
Loonie resumed it downward traction and dropped below 1.2265 level which once slipped to a three-year-low at 1.225 level, trading at 1.22679 as of writing. The slide in loonie took place while broad-base U.S. dollar decline, amid risk appetite and lower U.S. yields following mixed U.S. data. For RSI side, indicator shows 34 figures which suggest a bearish momentum ahead for short term. On averaging price perspective, 15-long SMA indicator turn it slope to downward movement while 60-long SMA indicator remaining it descending slope.
Sum up above, we expect market will sourround in consolidation between 1.2269 to 1.238 as market seems misdirection with blurred price momentum. Albeit, if market doesn’t stand above the first resistance at 1.238 level, we believe it remain bearish momentum for long term.
Resistance: 1.238, 1.246, 1.2491
Support: 1.225
Economic Data
|
Currency |
Data |
Time (GMT + 8) |
Forecast |
||||
|
GBP |
Composite PMI (Apr) |
16:30 |
60 |
||||
|
GBP |
Services PMI (Apr) |
16:30 |
60.1 |
||||
|
GBP |
BoE Interest Rate Decision (May) |
19:00 |
0.1% |
||||
|
USD |
Initial Jobless Claims |
20:30 |
540 K |
||||
-
Global - English

-
United Kingdom - English
-
France - Français

-
Spain - Español

-
Portugal - Português

-
Italy - Italiano

-
Germany - Deutsch

-
Turkey - Türkçe

-
MENA - العربية

-
MENA - English
-
Asia - English
-
India - English

-
Indonesia - Indonesia

-
Japan - 日本語

-
South Korea - 한국어

-
Malaysia - Bahasa Malaysia

-
Malaysia - English
-
Philippines - English

-
Vietnam - Tiếng Việt

-
Thailand - ไทย

-
China - 简体中文

-
China - 繁體中文

This site uses cookies to provide you with a great user experience.
By using vtmarkets.com, you accept
our cookie policy.
Start trading with
VT Markets today


![]()
Follow us on:


![]()


